
Figure 2.
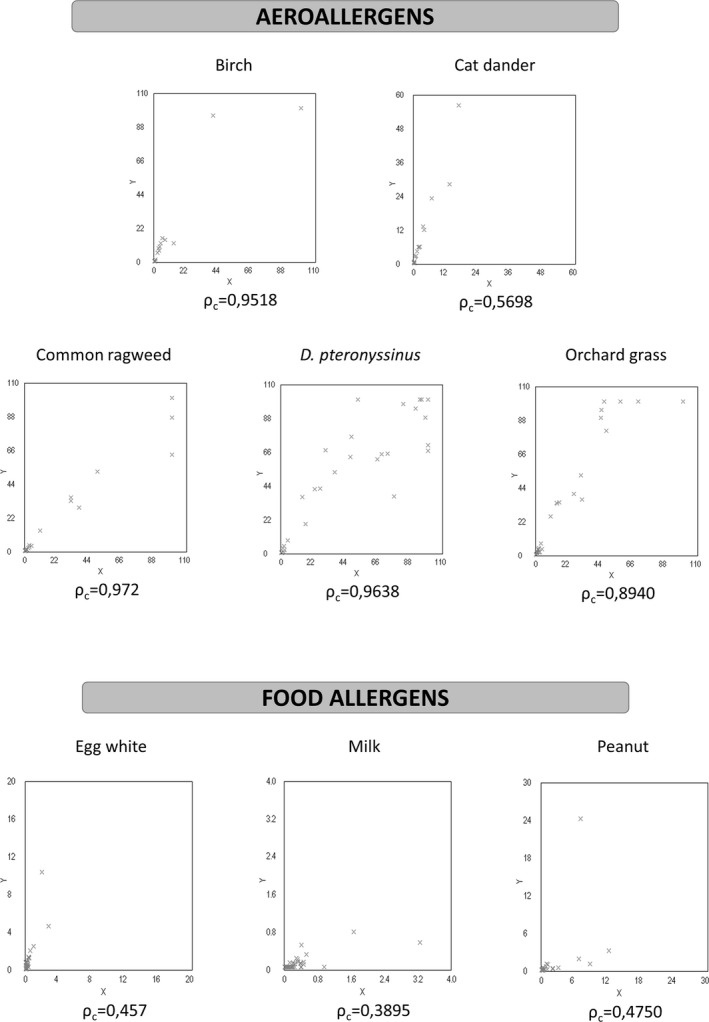
Scatterplots of intermethod comparison between Unicap 100 FEIA and Immulite 2000 CLEIA systems in nonselected patients for listed allergens (x‐axis = UniCAP 100; y‐axis = IMMULITE 2000).
Official websites use .gov
A
.gov website belongs to an official
government organization in the United States.
Secure .gov websites use HTTPS
A lock (
) or https:// means you've safely
connected to the .gov website. Share sensitive
information only on official, secure websites.
Scatterplots of intermethod comparison between Unicap 100 FEIA and Immulite 2000 CLEIA systems in nonselected patients for listed allergens (x‐axis = UniCAP 100; y‐axis = IMMULITE 2000).