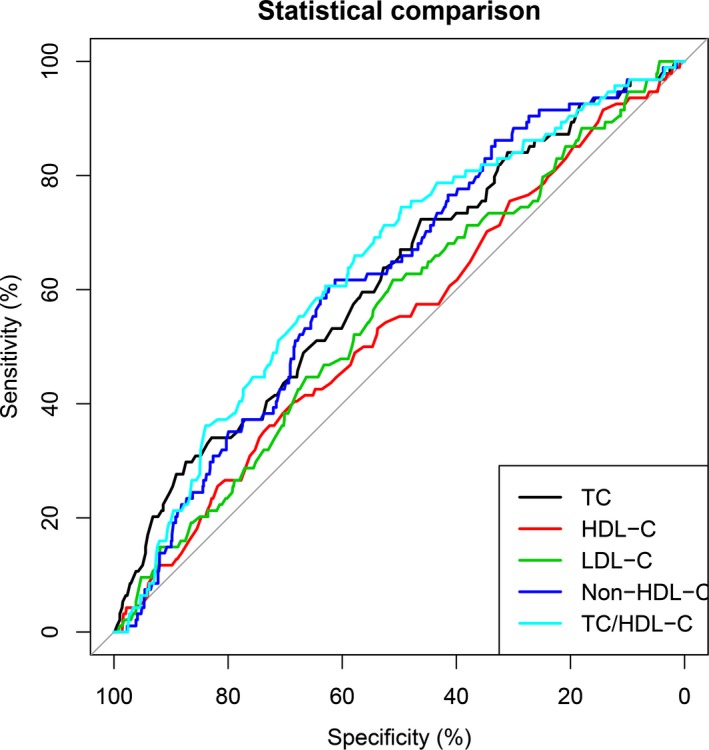
Figure 2.

Predictive values of lipid level and total cholesterol to high‐density lipoprotein cholesterol (TC/HDL‐C) ratio for death. Their predictive values are also determined by the receiver operating characteristic curves. Areas under the curves: 0.617 for TC, 0.542 for HDL‐C, 0.558 for LDL‐C, 0.621 for non‐HDL‐C, 0.643 for TC/HDL‐C
