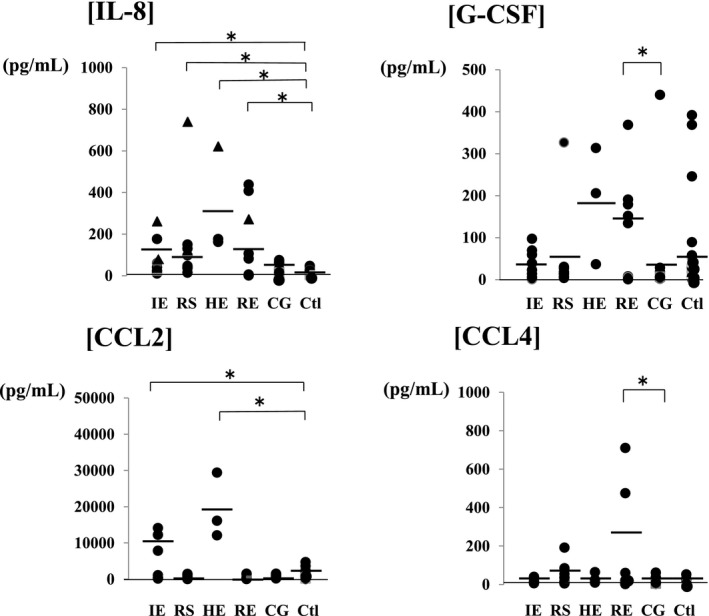
Figure 4.

Comparison of the cerebrospinal fluid chemokine levels in encephalopathy groups according to the causative virus. Among encephalopathy groups, IL‐8 was significantly increased in patients, irrespective of the causative virus (influenza virus: 168.5±84.5 pg/mL, RS virus: 138.8±104.9 pg/mL, HHV6: 320.4±213.3 pg/mL, and rotavirus: 164.5±120.9 pg/mL), and the increase was marked with a triangle in patients with poor neurological prognosis (Pediatric Cerebral Performance Category: PCPC >2) [19]. CCL2 was significantly increased in the influenza (10 116.6±5373.5 pg/mL) and HHV6 encephalopathy (19 205.1±7386.8 pg/mL) groups compared with the control group (1974.2±1092.5 pg/mL). G‐CSF (129.7±117.6 pg/mL) and CCL4 (263.7±255.2 pg/mL) were significantly increased in the rotavirus encephalopathy group compared with the convulsions following gastroenteritis group, and the increase in CCL4 in the rotavirus encephalopathy group was significantly higher than those of the other viral encephalopathy groups (influenza virus: 17.3±10.5 pg/mL, RS virus: 65.7±53.9 pg/mL, and HHV6: 32.9±23.2 pg/mL). Abbreviations: IE (n=9), influenza virus; RS (n=10), respiratory syncytial virus; HE (n=3), human herpes virus type 6; RE (n=8), rotavirus; CG (n=12), convulsion following gastroenteritis; Ctl (n=24), control; IL, interleukin; G‐CSF, granulocyte‐colony stimulating factor; CCL2, monocyte chemoattractant protein‐1/MCAF; CCL4, macrophage inflammatory protein‐1b. *P<.05
