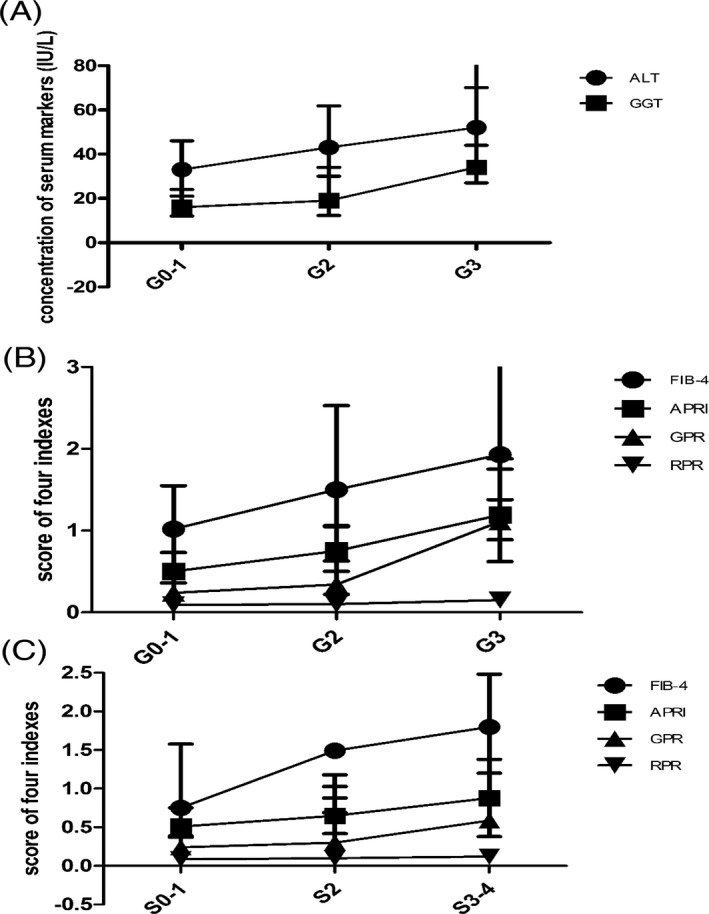
Figure 1.

Discount graph of ALT, GGT, APRI, FIB‐4, GGT and RPR in different groups according to Scheuer scoring system. A, Concentration of ALT and GGT in liver inflammation grades. B, Scores of FIB‐4, APRI, GPR, and PRP in different inflammation grades. C, Scores of FIB‐4, APRI, GPR, and PRP in different fibrosis stages
