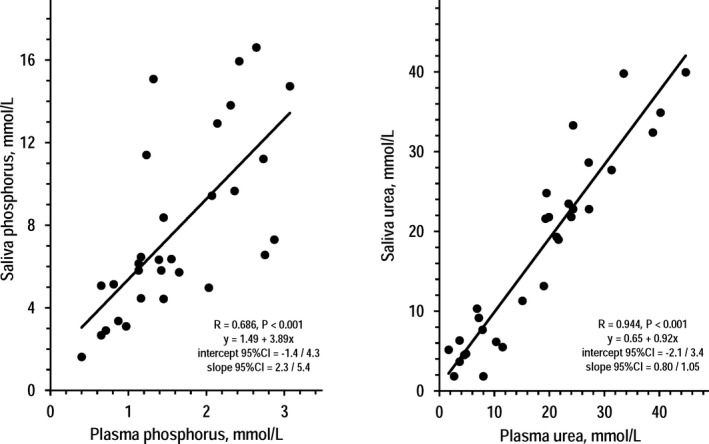
Figure 1.

Individual values of saliva phosphorus over plasma phosphorus (left panel) and of saliva urea over plasma urea (right panel) in the group of 30 CKD patients. For each set of data, the insert reports the correlation coefficient (R), P value, and regression equation with 95% CI of the coefficients
