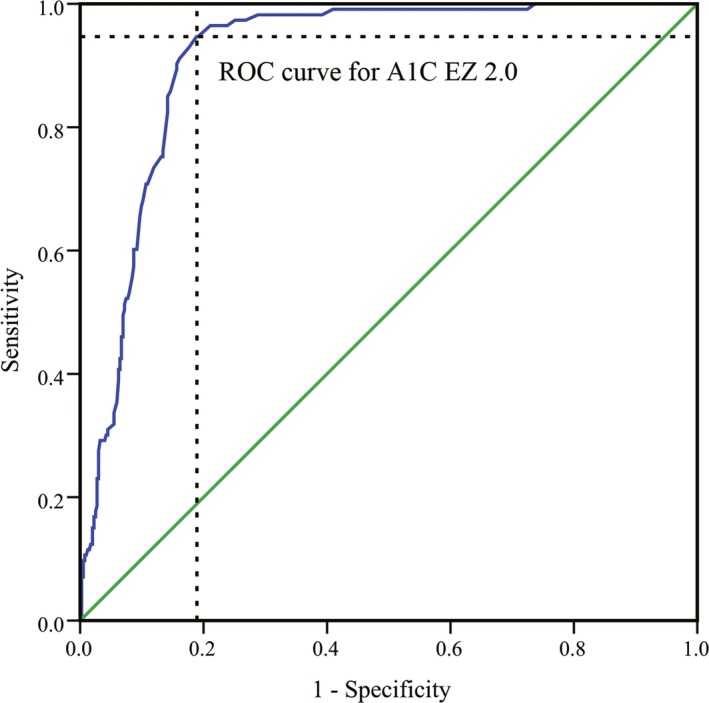
Figure 3.

ROC curve of the A1C EZ 2.0 analyzer for the diagnosis of diabetes. The area value under the curve (AUC) was 0.911 (95% confidence interval, 0.885‐0.937, P<.001). The Youden index was 0.758, and the corresponding diagnosis cut‐off point was 43.61 mmol/mol (6.14%). At an HbA1c level of 43.61 mmol/mol (6.14%), the sensitivity was 94.7%, and the specificity was 81.1% for the clinical diagnosis of diabetes
