
Figure 1.
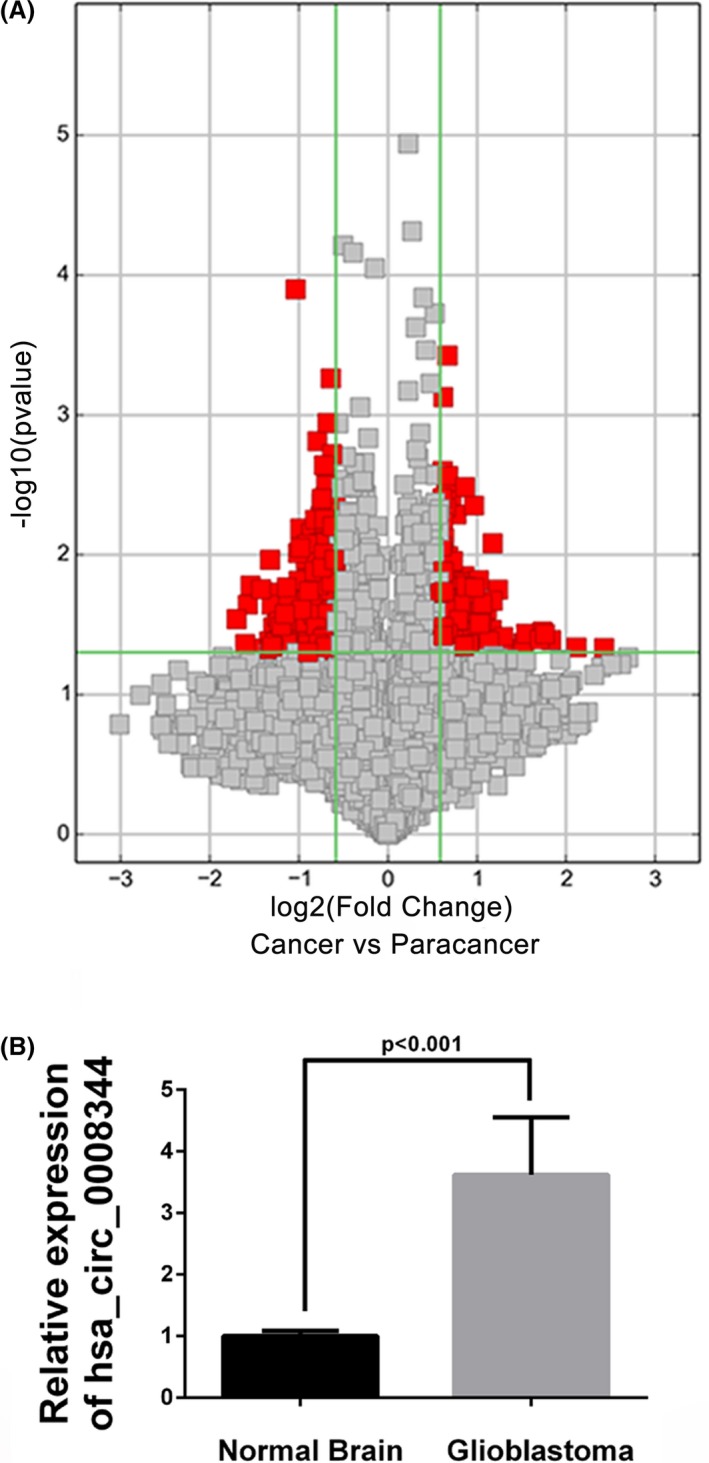
Hsa_circ_0008344 is upregulated in glioblastoma. A, Volcano plot of circRNAs. The vertical lines correspond to 1.5‐fold up and down, and the horizontal line represents a P value of .05. The red point in the plot represents the differentially expressed circRNAs with statistical significance. B, Hsa_circ_0008344 expression level is examined by qRT‐PCR and significantly higher in glioblastoma tissues than normal brain samples (P < .001)