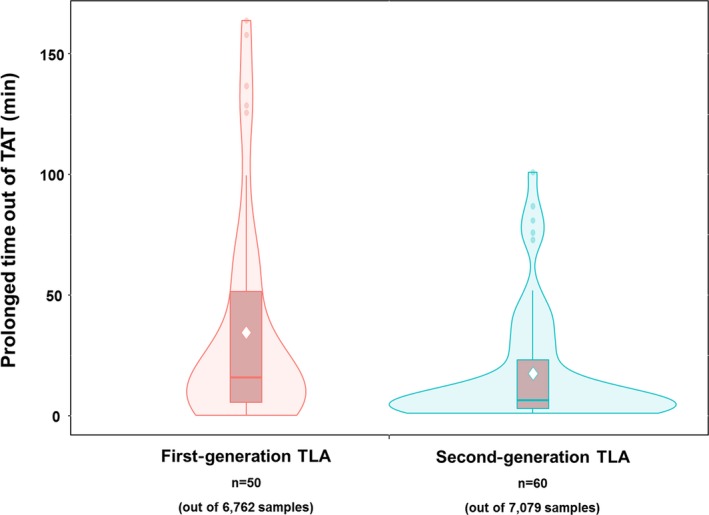
Figure 2.

The Violin Plot shows the distribution shape of the out of turnaround time (TAT) samples. In this figure, that the pattern of “prolonged time out of TAT” is more compressed can be recognized. In the density plot, the vertical line indicates the 95% confidence interval of “prolonged time out of TAT,” and the width indicates the frequency. The box indicates the interquartile range, with central horizontal line revealing the 50th percentile. The diamond point in the middle of the box in each group represents the mean value of “prolonged time out of TAT.” The mean “prolonged time out of acceptable TAT” in the chemistry samples was significantly shortened to 17.4 (±24.0) min after the fusion, from 34.5 (±43.4) min
