Abstract
Objectives
In this paper, a novel, sensitive and rapid method to simultaneously determine the free and total prostate‐specific antigen (fPSA and tPSA) in serum by combining a time‐resolved fluoroimmunoassay (TRFIA) and immunomagnetic separation was described.
Methods
The new approach uses magnetic particles as an immobilization matrix and means of separation, whereas the luminescent europium (Eu) and samarium (Sm) chelates are used as probes. The proposed method was evaluated via a single‐step, sandwich‐type TRFIA immunoassay of tPSA and fPSA as model analytes in serum.
Results
A new one‐step method to simultaneously detect fPSA and tPSA in less than 15 minutes was built up with the detection limits 0.006 ng/mL for fPSA and 0.05 ng/mL for tPSA. The assay ranges for fPSA and tPSA were both 0.5‐100 ng/mL, whereas the average recovery of those two obtained by our original mode were 95.9% and 95.3%, respectively. The present new TRFIA method carrying larger reproducibility, higher recovery, and sensitive specificity was demonstrated to be widely acceptable.
Conclusions
This simultaneous determination method containing a fast and sensitive approach can be put into an important position to screening large quantities of specimen, and be commonly applied to the clinical determination of fPSA and tPSA in human serum.
Keywords: free and total prostate‐specific antigen, magnetic nanoparticles, simultaneous detection, time‐resolved fluoroimmunoassay
1. Introduction
Prostate cancer (CAP) is the most common the most common form in human cancers but a poor diagnostic yield both here and abroad. Over the past decades, a remarkable increase in prostate‐specific antigen (PSA) in serum testing has been widely seen in diagnostic field, which was introduced in the late 1980s. PSA is a glycoprotein of 34 kDa and 261 amino acid residues.1, 2 In blood, total PSA (tPSA) is composed of free PSA (fPSA) and complexed PSA (cPSA), and the ratio of fPSA and tPSA was found to be a more sensitive marker of cancer than tPSA.3, 4
Over the past years, several analytical methods have been developing in this area of the serum determination of PSA, including the enzyme‐linked immunosorbent assay (ELISA),5 radioimmunoassay (RIA),6 Time‐resolved fluoroimmunoassay (TRFIA),7 chemiluminescence immunoassay (CLIA),8 chemiluminescent enzyme immunoassay (CLEIA),9 and electro chemiluminescence immunoassay (ECLIA).10
Here we describe a combination of one‐step dual‐label TRFIA and magnetic beads to establish a new immunoassay method for the simultaneous detection of fPSA and tPSA in serum with monoclonal antibodies (mAb) labeled with stable fluorescent chelates of europium (Eu) and samarium (Sm). The present combination of TRFIA and magnetic nanoparticles immensely improves sensitivity and significantly reduces the analysis time via a homogenous format, but also provides an interesting alternative tool for simultaneous determination of serum fPSA and tPSA in clinical laboratories.
2. Materials and Methods
2.1. Chemicals and apparatus
Bovine serum albumin (BSA), 4‐morpholineethanesulfonicacid (MES), N‐hydroxysulfosuccinimide (NHS), 1‐ethyl‐3‐(3‐dimethylaminopropyl) carbodiimide hydrochloride (EDC), dimethyl sulfoxide (DMSO), diethylenetriaminepentaacetate (DTPA), proclin‐300, and Tween‐20 were purchased from Sigma Chemical Co. (St. Louis, MO, USA). PD‐10 column and Sephadex G‐25 was purchased from Amersham Pharmacia Biotech (Piscataway, NJ, USA). Β‐Naphthoyltrifluoroacetone (β‐NTA) was synthesized in our laboratory. All other chemicals used were of analytical reagent grade and ultra‐pure water obtained using a Milli‐Q water purification system (Millipore, Bedford, MA, USA) was throughout the experiments.
The monoclonal anti‐PSA antibody (anti‐PSA McAb), anti‐free PSA antibody, secondary anti‐PSA McAb and PSA antigen were obtained from Medix (Grankulla, Finland). PSA (purity >95%, SDS‐PAGE) was provided by Meridian Life Science, Inc (Menphis, TN, USA). Magnetic nanoparticles (1101GA‐03) were obtained from JSR Life Sciences (Tokyo, Japan). All reactions were carried out in Polystyrene 96‐well microtiter plates from Nunc International (Roskilde, Denmark). Eu3+‐N1‐(p‐isothiocyanatobenzyl)‐diethylenetriamine‐N1, N2, N3, N4‐ tetraacetic acid (DTTA), Sm3+‐ DTTA, and a Victor 1420 Multilabel counter were purchased from PerkinElmer Life and Analytical Sciences (Waltham, MA, USA).
2.2. Samples and comparison method
All samples were kindly provided by Jiangsu Jiangyuan Hospital (Jiangsu Province, China) with the fPSA and tPSA values measured by ECLIA (Roche, Switzerland). All the patients were diagnosed on the basis of characteristic clinical features and confirmed by laboratory tests. These samples were stored at −20°C.
2.3. Solutions and buffers
PBS solution, 0.01 mol/L sodium phosphate buffer (pH 7.4) containing 0.9% NaCl; PBST solution, PBS containing 0.05% (v/v) Tween‐20; Enhancement solution,11 each liter of enhancement solution contained 15 μmol β‐NTA, 50 μmol trinoctylphosphine oxide, 1 mL Triton X‐100, and pH 3.2; Assay buffer, 50 mmol/L Tris‐HCl, containing 0.9% NaCl, 0.2% of BSA, 0.01% Tween‐20, 20 μM DTPA and 0.05% NaN3, pH 7.8; Standard buffer, 0.05 mol/L Tris–HCl, 1% BSA and 0.1% NaN3, pH 7.8; Elution buffer, 50 mmol/L Tris–HCl, containing 0.9% NaCl and 0.05% proclin‐300, pH 7.8; Blocking buffer, 50 mmol/L Tris‐HCl, containing 0.9% NaCl, 1% BSA, and 0.05% NaN3, pH 7.8.
2.4. Coating conjugate preparation
Magnetic nanoparticles (100 μL, 10 mg/mL) were firstly activated by using the mixture solution of EDC (200 μL, 50 mg/mL) and NHS (200 μL, 50 mg/mL). After incubation for 2 h at room temperature under gentle stirring, the mixture solution was washed three times with PBS solution. Under slight stirring, 1 mg anti‐PSA McAb was added to the activated magnetic nanoparticles in 1 mL PBS solution and incubated at room temperature for 18 h under gentle stirring and the mixtures were subsequently rinsed four times with PBST solution to remove unbound antibody. The resultant magnetic nanoparticles were blocked by blocking buffer for 1 h at room temperature. After a final rinsing with assay buffer, the magnetic nanoparticles–antibody conjugates were resuspended in assay buffer and stored at 4°C until use.
2.5. Labeling of antibodies
Firstly, 2 mL of anti‐free PSA antibody (1.0 mg/mL dissolved in 50 mmol/L of PBS) was loaded on a PD‐10 column with elution buffer. Next, 2 mg/500 μL anti‐free PSA antibody with changed buffer condition which was mixed with 1 mg DTTA‐Eu3+ and the mixture was incubated for 20 h at 25°C. The labeled antibody was separated and purified on a column of Sephadex G‐25 (1 cm × 20 cm) with elution buffer.
Sm3+‐labeled secondary anti‐PSA McAb was prepared similarly, except that 0.2 mg of Eu3+‐DTTA was replaced with 0.5 mg of Sm3+‐DTTA. Finally, the labeled antibody was stable for several months when stored in an amber bottle at −20°C.11, 12
2.6. Preparation of PSA and standards
Calibrators of fPSA and tPSA used in the assay were made from PSA antigen and diluted in standard buffer as 0, 0.5, 2, 4, 10, 50, and 100 ng/mL.
2.7. Assay protocol
The proposed immunoassay for the quantitation of fPSA and tPSA were performed based on a sandwich‐type immunoassay format by combining a TRFIA assay and immunomagnetic separation, which was shown schematically in Figure 1: Initially, 50 μL of magnetic nanoparticles coated with anti‐PSA McAb was added into microtiter plate well and mixed with 50 μL of standards or sample solution, followed by the addition of 100 μL of assay buffer containing 1:20 Eu3+‐labeled anti‐free PSA antibody/1:10 Sm3+‐labeled PSA McAb. After 10 min incubation with continuous gentle stirring at 37°C, the plate was positioned on the mag‐net for 5 seconds and the supernatant was discarded. After removing the free substances and rinsing with washing buffer six times, 200 μL of enhancement solution was added and then the immune complexes were resuspended in enhancement solution and the mixtures were incubated for 3 min at room temperature with slight stirring. Finally, the fluorescence signal was measured using an automatic time‐resolved fluorescence detector (AutoDELFLA1235, PerkinElmer, Inc.). The fluorescence of Eu3+ was measured at an excitation wavelength of 340 nm and an emission wavelength of 615 nm. The Sm3+ fluorescence was measured at an excitation wavelength of 340 nm and an emission wavelength of 642 nm.
Figure 1.
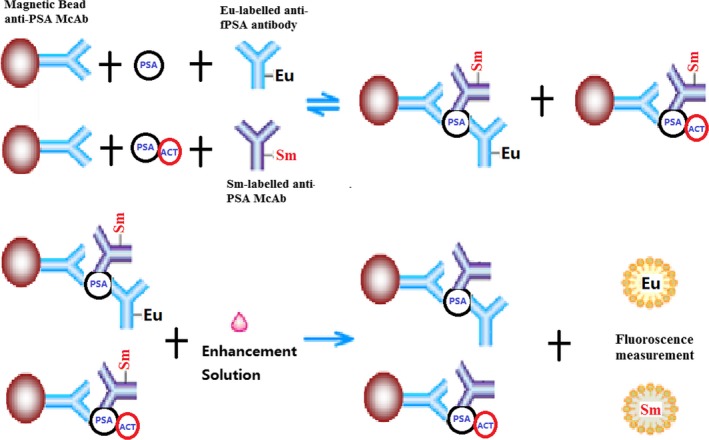
Diagram of the proposed method for fPSA and tPSA
2.8. Statistical analyses
Analysis of data was performed using SPSS 18.0 (Chicago, IL, USA). Standard curves were obtained by plotting the fluorescence intensity (Y) against the logarithm of the sample concentration (X) and fitted to a four‐parameter logistic equation using Origin7.5 SR1 from Microcal INC (Piscataway, NJ, USA) LogY=A+B×LogX.
3. Results
3.1. Labelling yield
When the anti‐free PSA antibody and secondary PSA antibody were labeled as described above, their average labeling yield were 13.4 Eu3+/McAb and 9.2 Sm3+/McAb, giving high sensitivity with low background (<1000 cps).
3.2. Optimization of the incubation time
Incubation temperature and time significantly influenced the reaction. For this research, a contrast test was carried out at 25°C and 37°C which are temperatures frequently used for incubation in other methods. The results showed that the reaction time was significantly reduced but the slope of the standard assay curve showed no significant difference to that at 25°C. Thus, 37°C was selected as the incubation temperature. Then, at 37°C, different incubation times (5, 10, 15, 20, and 25) were compared. The results showed that long incubation times could enhance the sensitivity of the assay. However, when the incubation time exceeded 10 min, the fluorescence intensities of all the tPSA and fPSA standard points reached a dynamic equilibrium. Therefore, 10 min was selected as the incubation time. These results are shown in Figure 2.
Figure 2.
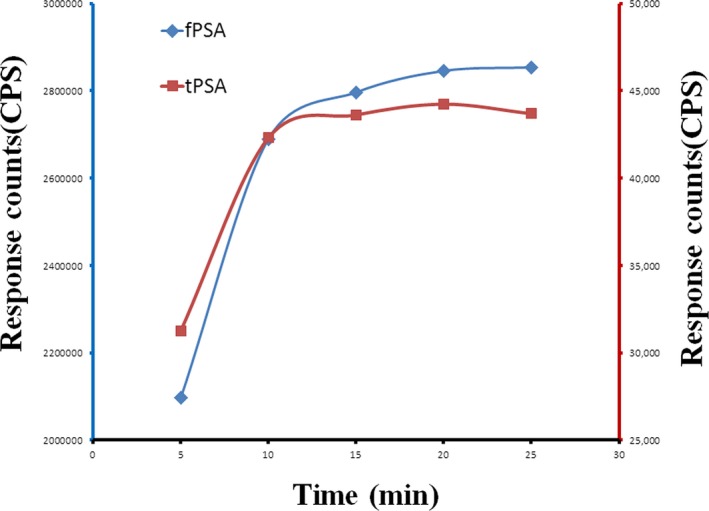
Standard curve at different incubation times
3.3. Optimization of the dilution ratios of Eu3+‐labeled anti‐free PSA antibody/Sm3+‐labeled anti‐PSA McAb
Optimization of the dilution ratios of Eu3+‐labeled anti‐free PSA antibody/Sm3+‐labeled anti‐PSA McAb (1:5, 1:10, 1:20, and 1: 40) was also done. The fluorescence intensity increased with decreasing dilution ratio of Eu3+‐labeled anti‐free PSA antibody/Sm3+‐labeled anti‐PSA McAb. However, if the dilution ratios of Eu3+‐labeled anti‐free PSA antibody/Sm3+‐labeled anti‐PSA McAb were 1:20/1:10, the fluorescence intensity tended to reach a maximum. Hence, the dilution ratio of Eu3+‐labeled anti‐free PSA antibody/Sm3+‐labeled anti‐PSA McAb of 1:20/1:10 were selected as the optimum because satisfactory signal intensity was achieved.
3.4. Analytical sensitivity and linear range
The sensitivity, detection range, recovery rate, reproducibility, and stability of this method were analyzed. The results from the experiments were processed by plotting standard curves (Figure 3) using the Log‐LogB function, LogY=A+B× LogX. The calibration curves of fPSA and tPSA were linear over the concentration. The equation were LogY=0.8676LogX+3.6114 (r 2=.9975) for the calibration of tPSA and LogY=0.907 LogX+5.4486 (r 2=.9993) for the calibration of fPSA.
Figure 3.
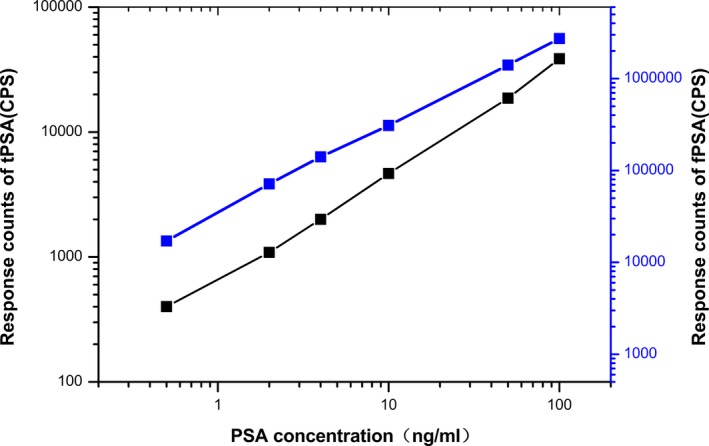
Standard curves of tPSA and fPSA
Signal saturation (“hook” effect) were seen when the range exceeded 500 ng/mL for fPSA and 300 ng/mL for tPSA (Figure 4).
Figure 4.
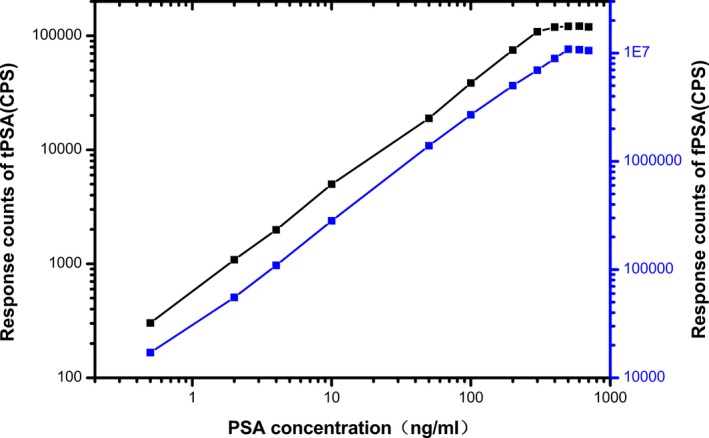
High‐dose signal saturation (hook‐effect) of tPSA and fPSA
On the standard curve, the concentration corresponding to the fluorescence count X+2SD, where X represents the fluorescence count at zero concentration, was used to determine the sensitivity of the assay. The reproducibility of this method was evaluated using the mean coefficient of variation (CV). For this study, the sensitivities of fPSA and tPSA were 0.006 ng/mL and 0.05 ng/mL, respectively. The measurement range of fPSA was 0.5‐100 ng/mL with the intra‐ and inter‐batch CVs of 4.8% and 6.7%, while the measurement range of tPSA was 0.5‐100 ng/mL with the intra‐ and inter‐batch CVs of 5.9% and 7.8%. After the assay reagent stored at 37°C for seven days, the binding ratio at each concentration was decreased by an average of 16.78%.
This indicated that the shelf‐life of a commercial kit would meet the requirements for practical application. The mean recoveries obtained by the same method using two concentrations of maternal serum controls measured five times were 95.8%, 94.8% for tPSA and 95.0%, 96.9% for fPSA, respectively (Table 1). Thus, the reproducibility and recoveries of the proposed assay in our cases were acceptable.
Table 1.
Recovery of tPSA and fPSA determined by the proposed method
| Sample | N | PSA added (ng/mL) | Mean ± SD (ng/mL) | Average recovery (%) | CV (%) |
|---|---|---|---|---|---|
| tPSA(1) | 5 | 0 | 1.21±0.11 | — | 9.1 |
| 5 | 10 | 11.04±0.67 | 85.9 | 6.1 | |
| 5 | 50 | 51.15±2.35 | 95 | 4.6 | |
| 5 | 100 | 101.29±4.09 | 106.6 | 4 | |
| tPSA(2) | 5 | 0 | 54.85±2.58 | — | 4.7 |
| 5 | 10 | 60.13±2.74 | 91.4 | 4.6 | |
| 5 | 50 | 102.29±4.14 | 95.3 | 4 | |
| 5 | 100 | 153.64±6.42 | 97.8 | 4.2 | |
| fPSA(1) | 5 | 0 | 0.67±0.06 | — | 9 |
| 5 | 10 | 10.55±0.76 | 82.1 | 7.2 | |
| 5 | 50 | 50.65±2.35 | 97 | 4.6 | |
| 5 | 100 | 100.71±4.52 | 106 | 4.5 | |
| fPSA(2) | 5 | 0 | 21.37±1.08 | — | 5.1 |
| 5 | 10 | 30.59±1.34 | 96.4 | 4.4 | |
| 5 | 50 | 70.98±3.07 | 98.2 | 4.3 | |
| 5 | 100 | 120.54±5.57 | 96.1 | 4.6 |
Table 2 gives the results of the dilution linearity of novel assay when we used samples serially diluted with assay buffer. Expected values were derived from initial concentrations of analyses in the undiluted samples. Correlating the results obtained from novel assay with the expected concentrations, we found that the dilution curves were linear over the whole range of concentrations. Expected and measured values were well correlated.
Table 2.
Dilution linearity of the proposed method for tPSA and fPSA
| Sample | Dilution | Expected (ng/mL) | Observed (ng/mL) | Recovery (%) | |
|---|---|---|---|---|---|
| tPSA | 1 | NA | 4.02 | ||
| 01:02 | 2.01 | 1.98 | 98.51 | ||
| 01:04 | 1.01 | 0.96 | 95.05 | ||
| 01:08 | 0.5 | 0.53 | 106 | ||
| 01:16 | 0.25 | 0.26 | 104 | ||
| 01:32 | 0.13 | 0.11 | 84.62 | ||
| 2 | NA | 37.45 | |||
| 01:02 | 18.73 | 17.93 | 95.73 | ||
| 01:04 | 9.36 | 9.61 | 102.67 | ||
| 01:08 | 4.68 | 4.51 | 96.37 | ||
| 01:16 | 2.34 | 2.19 | 93.59 | ||
| 01:32 | 1.17 | 1.07 | 91.45 | ||
| 3 | NA | 87.23 | |||
| 01:02 | 43.62 | 44.68 | 102.43 | ||
| 01:04 | 21.81 | 22.51 | 103.21 | ||
| 01:08 | 10.9 | 10.51 | 96.42 | ||
| 01:16 | 5.45 | 5.19 | 95.23 | ||
| 01:32 | 2.73 | 2.59 | 94.87 | ||
| fPSA | 1 | NA | 1.34 | ||
| 01:02 | 0.67 | 0.71 | 105.97 | ||
| 01:04 | 0.34 | 0.36 | 105.88 | ||
| 01:08 | 0.18 | 0.21 | 116.67 | ||
| 01:16 | 0.08 | – | – | ||
| 01:32 | 0.04 | – | – | ||
| 2 | NA | 26.75 | |||
| 01:02 | 13.38 | 12.98 | 97.01 | ||
| 01:04 | 6.69 | 6.57 | 98.21 | ||
| 01:08 | 3.34 | 3.26 | 97.6 | ||
| 01:16 | 1.67 | 1.72 | 102.99 | ||
| 01:32 | 0.84 | 0.89 | 105.95 | ||
| 3 | NA | 59.26 | |||
| 01:02 | 29.63 | 28.37 | 95.75 | ||
| 01:04 | 14.82 | 15.01 | 101.28 | ||
| 01:08 | 7.41 | 7.29 | 98.38 | ||
| 01:16 | 3.7 | 3.83 | 103.51 | ||
| 01:32 | 1.85 | 1.89 | 102.16 |
The specificity of the assay for tPSA and fPSA were evaluated by measuring the cross‐reactivity with four tumor markers (AFP, CEA, CA125, CA19‐9). There was no cross‐reactivity with AFP, CEA, CA125, and CA19‐9 (less than 1%). Therefore, considering an excellent specific immune reaction, our novel assay would take a bright future in the determination of fPSA and tPSA in human serum.
3.5. Clinical application of the established assays
To further evaluate the feasibility of the new method for clinical applications, 110 serum samples from patients with different prostate diseases and 15 serum samples from health person were recruited. tPSA and fPSA levels were measured by this new method and compared with those detected by a commercially available ECLIA kit. Linear regression analyses revealed good correlations between the developed method and ECLIA (Figures 5 and 6). The equation of the regression curve were Y=0.9883X+0.2785 (R 2=.9927) for tPSA and Y=0.9943X+0.1279 (R 2=.9909) for fPSA, where Y is the PSA concentration estimated with the proposed method and X is the PSA concentration from ECLIA methods. The magnetic particle‐based TRFIA method had a good correlation with ECLIA methods. This finding indicated that the proposed assay could serve for clinical determination of tPSA and fPSA in human serum.
Figure 5.
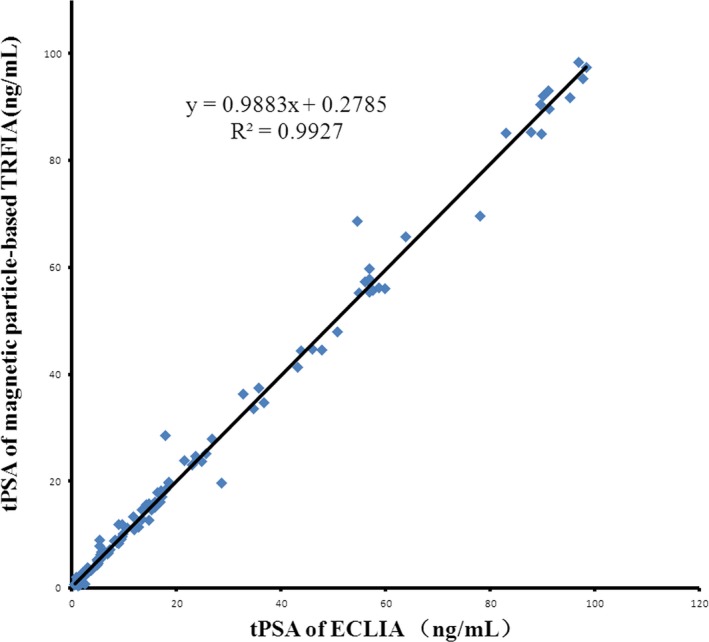
Comparisons of the proposed method and ECLIA results for determination of tPSA
Figure 6.
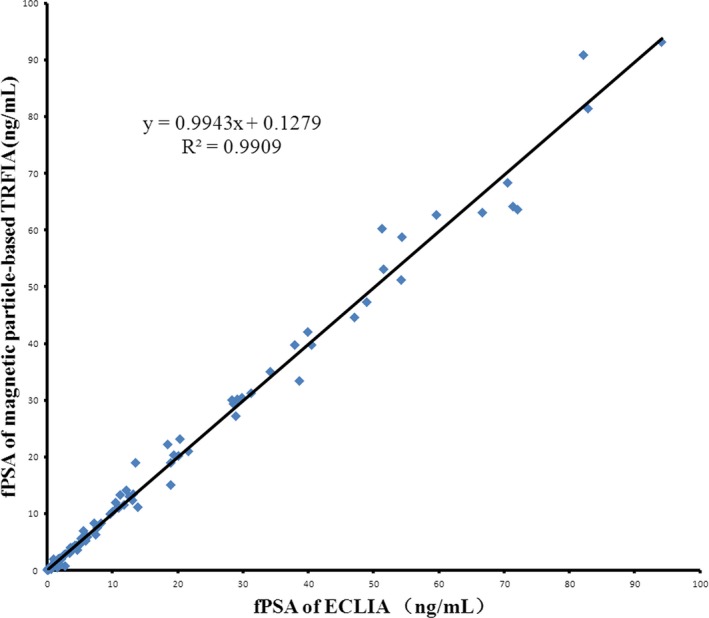
Comparisons of the proposed method and ECLIA results for determination of fPSA
4. Discussion
Mitrunen13 provided a Dual‐label one‐step immunoassay for simultaneous measurement of fPSA and tPSA. This method can be performed in a rapid and easy one‐step dual‐label assay using stable fluorescent Eu and Tb chelates within 30 min with yielded LOD of 0.01 ng/mL for fPSA and 0.1 ng/mL for tPSA.
Despite the promising lands created by the TRFIA assay especially dual‐label format, limitations in the conventional TRFIA methodology still remain. For instance, the specific antigen or antibody is usually coated on the plastic surface of 96‐well microplates, which is unstable and can be readily carried off. Furthermore, this kind of traditional operation causes much more time wasted. On the other hand, magnetic nanoparticle has been successfully applied in many different fields, including DNA extraction, cell separation, biomolecule detection, and various immunoassay methodologies by taking advantage of a magnetic separation or mixing process.14, 15, 16, 17
According to the method provided by Mitrunen,13 a new TRFIA to simultaneous detect fPSA and tPSA was established, combining with magnetic particles in less than 15 min with yielded LOD of 0.006 ng/mL for fPSA and 0.05 ng/mL for tPSA. This assay was characterized by immobilization of anti‐PSA McAb on the surface of magnetic beads and two antibodies labeled with stable fluorescent chelates of Eu and Sm. Eu3+ chelate is the most commonly used label in TRFIA analysis because of its higher fluorescence yield and lower background than other lanthanide complexes. Tb3+ chelate usually has a longer decay time and a higher fluorescence yield than Sm3+ chelate, and their fluorescence is less sensitive to aqueous quenching. However, the relatively shorter emission wavelength of Tb3+ chelate (545 nm) makes it more prone to interference (eg. phosphorescence) derived from plastic or glass materials. In addition, it is required to use an aliphatic β‐diketone to enhance the fluorescence of Tb3+ in immunoassay for DELFIA‐type of multiple analytes.18, 19 Considering these factors, we selected Eu3+ and Sm3+ as labels in the present study.
Magnetic nanoparticle with antibodies is a very useful tool for immunoassays. Utilizing magnetic nanoparticles beads could be critical to protect the specific antigen or antibody from being washed away and reduce the analysis time. Unlike conventional double‐label simultaneous TRFIA, antibodies went hand in hand to the surface of magnetic beads rather than immobilized on the surface of 96‐well microplates. The magnetic nanoparticles beads suspended in the reaction solution provide a relatively larger surface area, which enabled more antibodies to be coupled to the surface efficiently. Overall, in an approach of our novel TRFIA method, less consumption of reagent would be taken as well as more antibodies be immobilized, which is appreciable to broadening the linear range of detection. In addition, antibody‐coated magnetic nanoparticles beads employed as a solid phase in suspension to capture target analytes could optimize more antigens to become accessible within a short time. The combination of double‐label simultaneous TRFIA and magnetic nanoparticles improves sensitivity and significantly reduces the analysis time via a homogenous format, and provides a simple one‐step dual‐label immunoassay for simultaneous measurement of serum fPSA and tPSA in clinical laboratories.
In summary, the new approach uses magnetic particles as an immobilization matrix and a mean of separation, whereas the luminescent europium and samarium chelates are used as probes. The proposed fast method was evaluated via a single‐step, sandwich‐type TRFIA immunoassay of fPSA and tPSA as model analytes in serum. With the advantages of magnetic particles, we provided a homogenous format for simultaneous measurement of fPSA and tPSA within 15 min. This new immunoassay exhibited a wide dynamic range for fPSA of 0.5‐500 ng/mL, with a lower detection limit of 0.006 ng/mL. The dynamic range for tPSA was 0.5‐300 ng/mL, with a lower detection limit of 0.05 ng/mL. Satisfactory specificity, excellent reproducibility, and higher recovery of the immunoassay were also expounded clearly in the above date. Good correlations were obtained in the analysis of 110 human serum samples between the proposed method and a commercial available ECLIA kit method as a rapid and highly sensitive immunoassay that could be developed into a platform for multi‐analyte determinations in clinical practice.
Ethical approval
The study was approved by Jiangsu Institute of Nuclear Medicine ethics committees in China (No. 201503007 from Jiangsu Institute of Nuclear Medicine). Informed consent was obtained from all study participants during the medical examination.
Authors' contributions
Biao Huang, Zhongwei Lv, and Jue Zhang researched literature and conceived the study. Jun Fan and Yi Zhang were involved in protocol development, gaining ethical approval, patient recruitment, and data analysis. Bin Zhou wrote the first draft of the manuscript. All authors reviewed and edited the manuscript and approved the final version of the manuscript.
Acknowledgments
This work was supported by the Technology Research Program of Wuxi City (2014CSB11N1305).
Zhou B, Zhang J, Lv Z, Fan J, Zhang Y, and Huang B. Simultaneous determination of free and total prostate‐specific antigen by a magnetic particle‐based time‐resolved fluoroimmunoassay. J Clin Lab Anal. 2017;31:e22137 10.1002/jcla.22137
References
- 1. Thompson IM, Pauler DK, Goodman PJ. Die PSA‐density als parameter zur Verbesserung der Prostatakarzinomdiagnostik – Vergleich zum PSA und zum prozentualen freien PSA. N Eng J Med. 2004;350:2239–2246. [Google Scholar]
- 2. Dijkstra S, Mulders PF, Schalken JA. Clinical use of novel urine and blood based prostate cancer biomarkers: A review. Clin Biochem. 2014;47:889–896. [DOI] [PubMed] [Google Scholar]
- 3. Oesterling JE. Prostate specific antigen: A critical assessment of the most useful tumor marker for adenocarcinoma of the prostate. J Urol. 1991;145:907–923. [DOI] [PubMed] [Google Scholar]
- 4. Lacher DA, Hughes JP. Total, free, and complexes prostate‐specific antigen levels among US men, 2007–2010. Clin Chim Acta. 2015;448:220–227. [DOI] [PMC free article] [PubMed] [Google Scholar]
- 5. Stowell LI, Sharman LE, Hamel K. An enzyme‐linked immunosorbent assay (ELISA) for prostate‐specific antigen. Forensic Sci Int. 1991;50:125–138. [DOI] [PubMed] [Google Scholar]
- 6. Graves HC, Wehner N, Stamey TA. Ultrasensitive radioimmunoassay of prostate specific antigen. Clin Chem. 1992;38:735–742. [PubMed] [Google Scholar]
- 7. Härmä H, Keränen AM, Lövgren T. Synthesis and characterization of europium (III) nanoparticles for time‐resolved fluoroimmunoassay of prostate‐specific antigen. Nanotechnology. 2007;18:601–604. [DOI] [PubMed] [Google Scholar]
- 8. Adachi T, Moriya K, Esaki K. Evaluation of chemiluminescence immunoassay PSA (ACS‐PSA) for detection of prostate cancer. Hinyokika Kiyo. 1998;44:469–476. [PubMed] [Google Scholar]
- 9. Liu R, Wang C, Jiang Q, Zhang W, Yue Z, Liu G. Magnetic‐particle‐based, ultrasensitive chemiluminescence enzyme immunoassay for free prostate‐specific antigen. Anal Chim Acta. 2013;801:91–96. [DOI] [PubMed] [Google Scholar]
- 10. Emokpae MA, Das SC, Orok T, Mohammed AZ, Hassan SA. Early detection of prostate cancer: Evaluating the diagnostic performance of prostate specific antigen by comparing with histological technique among Africans. Indian J Clin Biochem. 2004;19:62–66. [DOI] [PMC free article] [PubMed] [Google Scholar]
- 11. Hu MY, Liang GL, Yu YH. Synthesis of β‐NTA and research of enhancement solution of time‐resolved fluoroimmunoassay. Chin J Nucl Med. 2001;21:224–225. [Google Scholar]
- 12. Huang B, Xiao HL, Zhu LG. Time ‐resolved fluoroimmunoassay of α‐fetoprotein. Asian J Nucl Med. 2001;1:40–42. [Google Scholar]
- 13. Mitrunen K, Pettersson K, Piironen T, Björk T, Lilja H, Lövgren T. Dual‐label one‐step immunoassay for simultaneous measurement of free and total prostate‐specific antigen concentrations and ratios in serum. Clin Chem. 1995;41(8):1115–1120. [PubMed] [Google Scholar]
- 14. Wang J, Xu D, Kawde AN, Polsky R. Metal nanoparticle‐based electrochemical stripping potentiometric detection of DNA hybridization. Anal Chem. 2001;73:5576–5581. [DOI] [PubMed] [Google Scholar]
- 15. Cao ZJ, Xia Y, Kai M, Lu JZ. Magnetic bead‐based label‐free chemiluminescence detection of specific DNA sequence‐telomere. Acta Chim Sin. 2005;63:407–410. [Google Scholar]
- 16. Liu YJ, Guo SS, Zhang ZL, et al. Integration of minisolenoids in microfluidic device for magnetic bead–based immunoassays. J Appl Phys. 2007;102:084911–084916. [Google Scholar]
- 17. Park ME, Chang JH. High throughput human DNA purification with aminosilanes tailored silica‐coated magnetic nanoparticles. Mater Sci Eng C. 2007;27:1232–1235. [Google Scholar]
- 18. Hemmila I, Dakubu S, Mukukala VM. Europium as a label in time‐resolved fluoroimmunoassay. Anal Biochem. 1984;137:33–34. [DOI] [PubMed] [Google Scholar]
- 19. Hemmilä I. Time‐resolved fluorometric determination of terbium in aqueous solution. Anal Chem. 1985;57:1676–1681. [Google Scholar]


