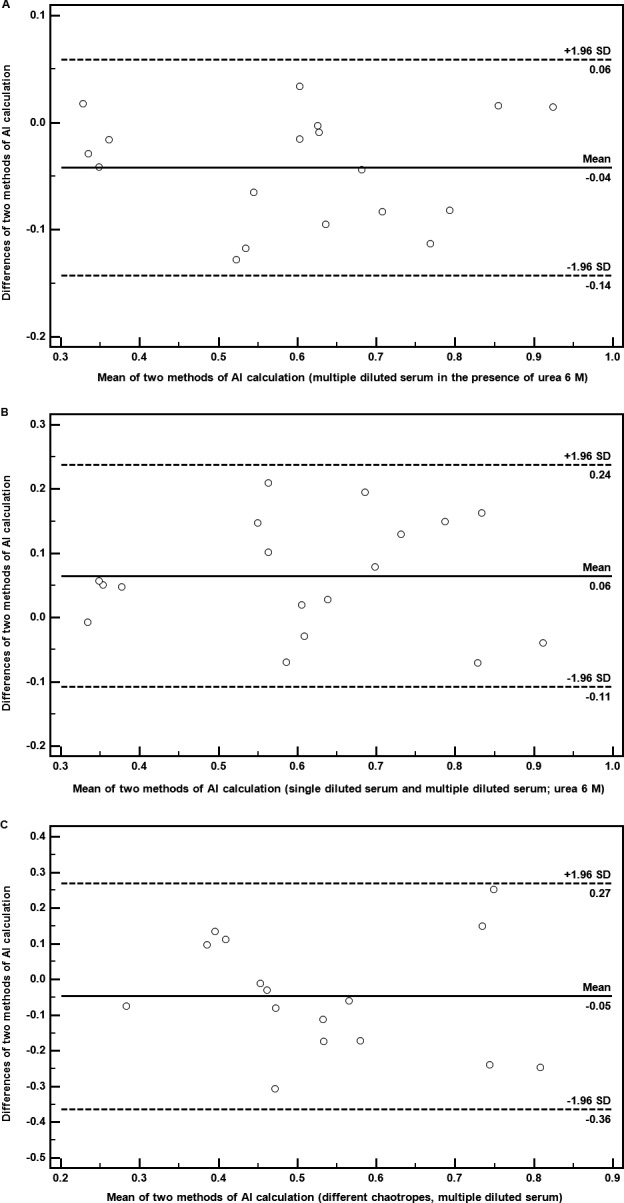
Figure 2.

(A) Representative Bland‐Altman plot comparing avidity indices determined by ELISA using a multiple diluted serum in the presence of urea 6 mol/L calculated according formula of Perciani et al. 21 and our modified method. (B) Representative Bland‐Altman plot comparing avidity indices based on ELISA using a multiple diluted serum and a single diluted serum (1:50) in the presence of urea 6 mol/L. (C) Representative Bland‐Altman plot comparing avidity indices based on ELISA using different chaotropes (area calculation: urea 6 mol/L and NaCl 1 mol/L)
