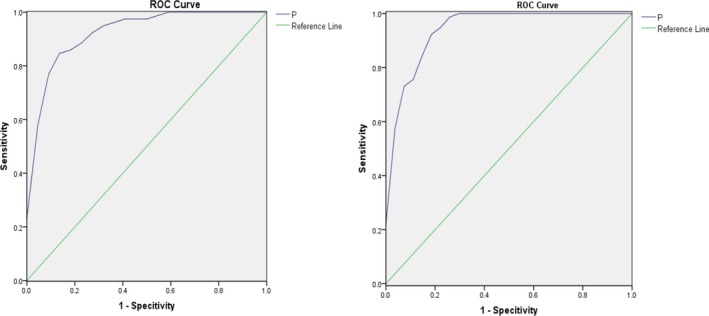
Figure 3.

ROC curve of classification equation. (Left) Combining predictors distinguishing patients with CKD with normal kidney function and healthy controls. (Right) Combining predictors distinguishing patients with CKD with decreased kidney function and healthy controls
