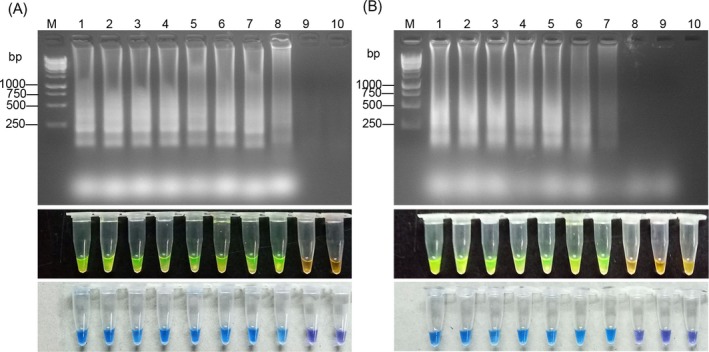
Figure 4.

Sensitivity assay of RT‐LAMP and LAMP. (A) Electrophoresis and dye pattern of calcein and HNB of RT‐LAMP. (B) Electrophoresis and dye pattern of calcein and HNB of LAMP. M: 250 bp DNA marker. Lanes 1‐9: 1.0 × 10⁷, 1.0 × 10⁶, 1.0 × 10⁵, 1.0 × 10⁴, 1.0 × 10³, 1.0 × 10², 1.0 × 101, 1.0 × 100, 1.0 × 10⁻¹ CFU/mL. Lane 10: Negative control
