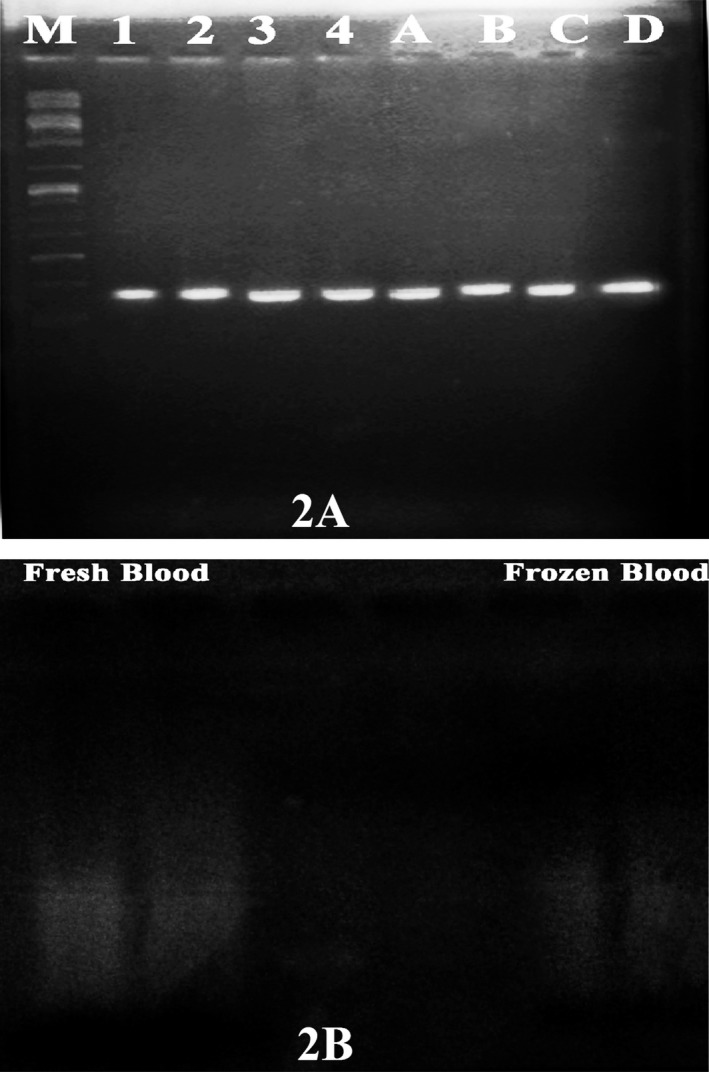
Figure 2.

(A) One percent agarose gel electrophoresis showing the PCR amplification products of the GH gene from fresh and frozen blood samples. Lanes 1‐4 corresponds to fresh blood from samples 1, 3, 7,10, respectively, while lanes A‐D corresponds to frozen blood from the same samples. (B) Double digested fresh and frozen blood samples run on 1% agarose gel. Eco RI and Hind III were used for the digestion
