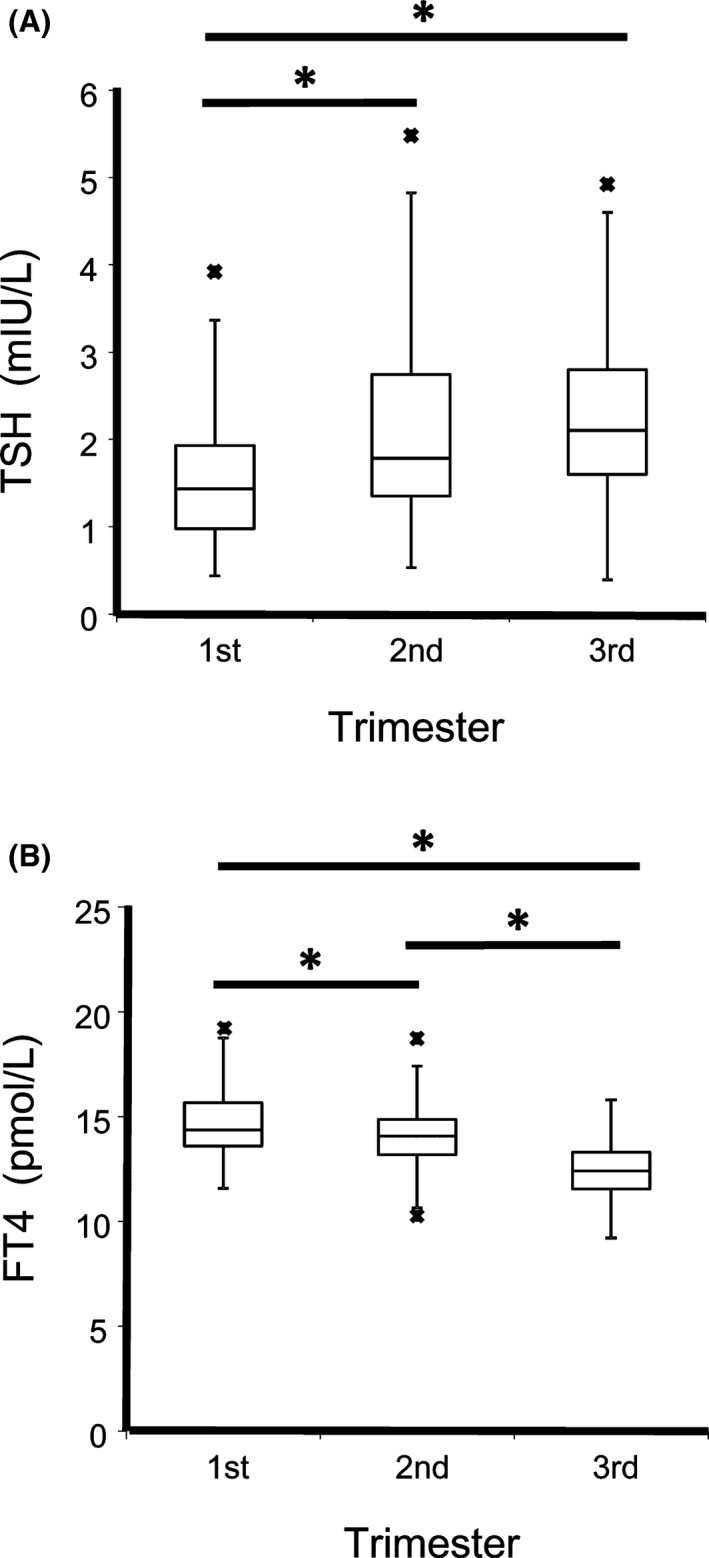
Figure 1.

Box plots of serum thyroid stimulating hormone (TSH) (A) and FT4 (B) levels in each gestational trimester. The boxes give the upper and lower quartiles; the vertical and narrow horizontal lines define the results range (including data that are between the 1.5 interquartile range (IQR) of the lower quartile and the 1.5 IQR of the upper quartile). The wide horizontal lines mark the median values. The minimum or maximum values outside the range are presented as asterisks below or above the horizontal bars of each box. TSH and FT4 results of each trimester were compared pair wise by Mann‐Whitney test, with asterisks indicating statistical significance (P < .05) of above comparing groups
