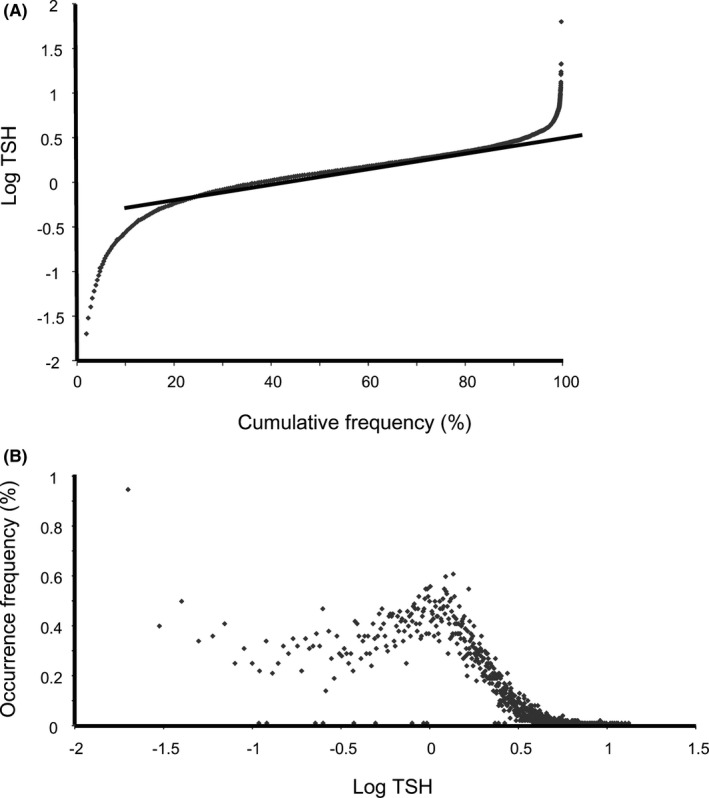
Figure 2.

Frequency output graphs for thyroid stimulating hormone (TSH) indirect RI analysis with outpatient results. A, Cumulative frequency graph versus TSH levels (logarithm scale) and regression line (straight dotted line) with outliers removed. The linear regression equation is y = 0.01142x ‐ 0.62653 (n = 9924). B, Scatter graph of TSH levels (logarithm scale) versus occurrence frequency
