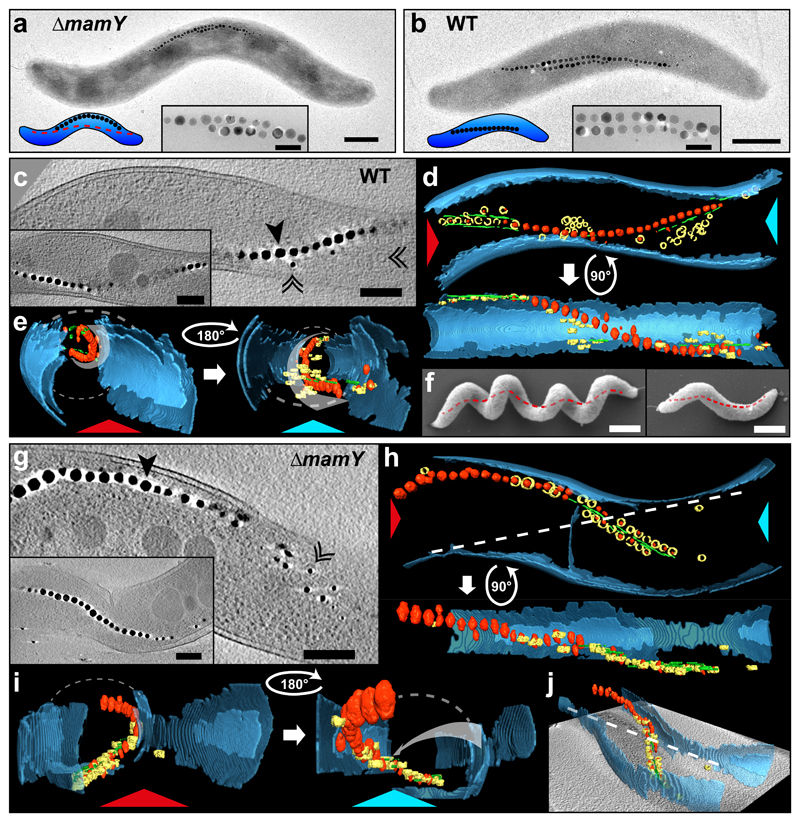
Figure 1. MamY determines the localization of the magnetosome chain at the geodetic axis of Magnetospirillum gryphiswaldense.
(a) TEM micrograph of a ΔmamY cell with magnetosome chain (black electron-dense magnetite crystals) mispositioned at the negative curvature (100% of cells. N = 126). The model (lower-left corner) indicates the theoretical WT chain position (red-dashed line).
(b) TEM of a WT cell. The magnetosome chain seemingly touches sites of positive curvature (100% of cells. N = 167).
Insets in (a) and (b): magnification of magnetite crystals. Scale bar: 500 nm (inset: 100 nm).
(c-e) Cryo-ET of a WT cell. (c) A 15.7 nm tomographic slice through the center of the cell showing magnetosome vesicles (black-double arrowheads) and magnetite crystals (black arrowhead). Inset: tomographic slice at different z-depth displays magnetosome chain continuity and close proximity to the positively-curved cytoplasmic membrane. Scale bars: 200 nm. (d) 3D-rendering of the tomogram from the cell in (c). Magnetite crystals: red; magnetosome vesicles: yellow; MamK filament: green; Inner and outer membranes: blue. (e) 3D-rendering views from the angle indicated by the red and light-blue arrowheads in (d). Curved-white-dashed lines: membrane projection (approximation, missing wedge). White-curved arrows: magnetosome chain track inside the cell along the positive cytoplasmic membrane curvature.
(f) SEM image of two Mgryph cells (of different length) highlighting their helical morphology and geodetic axis (red-dashed line). Scale bars: 500 nm.
(g-j) Cryo-ET of a ΔmamY cell. (g) A 15.7 nm tomographic slice with the magnetosome chain shifted to the negative membrane curvature. Inset: tomographic slice of another ΔmamY cell. Scale bars: 200 nm. (h) 3D-rendering from the tomogram of the cell from (g). (i) 3D-rendering views -indicated by the red and light-blue arrowheads in (h)- shows misplacement of the magnetosome chain apart from the geodetic axis. (j) 3D-rendering and tomogram slice of the same cell in perspective. White-dashed-straight line in (h) and (j): projection of the geodetic axis in 2D. Grey-curved arrow in (i -right panel): theoretical geodetic axis. Similar tomograms (for WT and ΔmamY strains) have been obtained from at least three experiments using independent preparations of cells.

