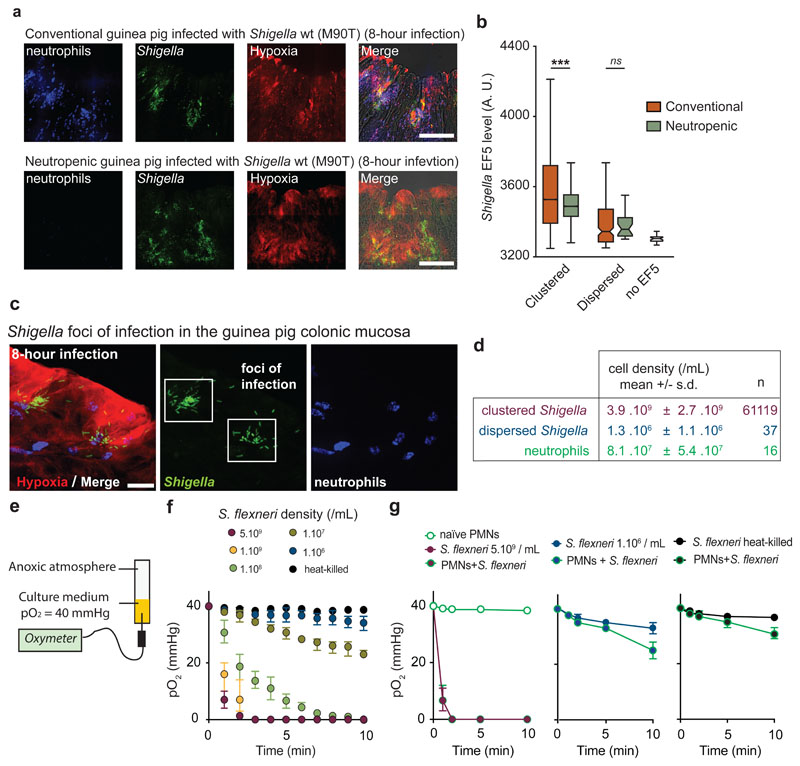
Figure 2. Neutrophils are not essential for O2 depletion in infected tissues, which is mainly caused by Shigella aerobic respiration.
a. S. flexneri pGFP (green) foci of infection were detected in conventional (8 animals, 28 acquisitions) and neutropenic (3 animals, 7 acquisitions) guinea pig colonic mucosa. Neutrophils were labeled with Myelotracker-Dylight40512 (blue) and hypoxia with an α-EF5-Cy3 (red). Scale bar: 50 µm.
b. Hypoxia levels around ‘clustered’ bacteria were comparable between conventional vs neutropenic animals (p < 0.0001, see Supplementary Table 3).
c-d. Cell density of ‘clustered’ (in foci of infection) and ‘dispersed’ S. flexneri pGFP (green) populations were calculated in vivo (expressed as mean ± S.D). Neutrophils were labeled with Myelotracker-Dylight40512 (blue) and hypoxic areas with an α-EF5-Cy3 (red). Scale bar: 2 µm. For clustered bacteria, the density is calculated as the number of bacteria around each clustered bacterium within 16 µm for 61119 bacteria. For dispersed bacteria and neutrophils, the density is calculated as the number of dispersed bacteria (n = 37 loci imaged), respectively neutrophils (n = 16 loci imaged), divided by the imaged tissue volume.
e. O2 consumption rates were assessed in vitro with an oximeter in a RPMI 1640 + 10 mM Hepes culture medium stabilized at 40 mmHg (hypoxic chamber) in tubes sealed under anoxic conditions (see Methods). Exponentially grown bacterial cultures were inoculated at the indicated concentration (t = 0).
f. O2 depletion rate was correlated with S. flexneri bacterial density. O2 tensions (expressed as mean ± S.D.) were assessed at indicated cell densities surrounding ‘clustered’ and ‘dispersed’ population densities calculated in vivo (see d.) or in the presence of 5.109 heat-killed S. flexneri (n = 3 independent experiments).
g. O2 depletion rate (O2 tensions expressed as mean ± S.D., n = 3 independent experiments) in the presence of S. flexneri and neutrophils (PMNs, 8.107 neutrophils/mL). In the presence of 1.106 S. flexneri/mL or 5.109 heat-killed S. flexneri/mL, anoxia was not reached over the measurement period, although neutrophil O2-consumption was observed (10 min, see Supplementary Table 4).

