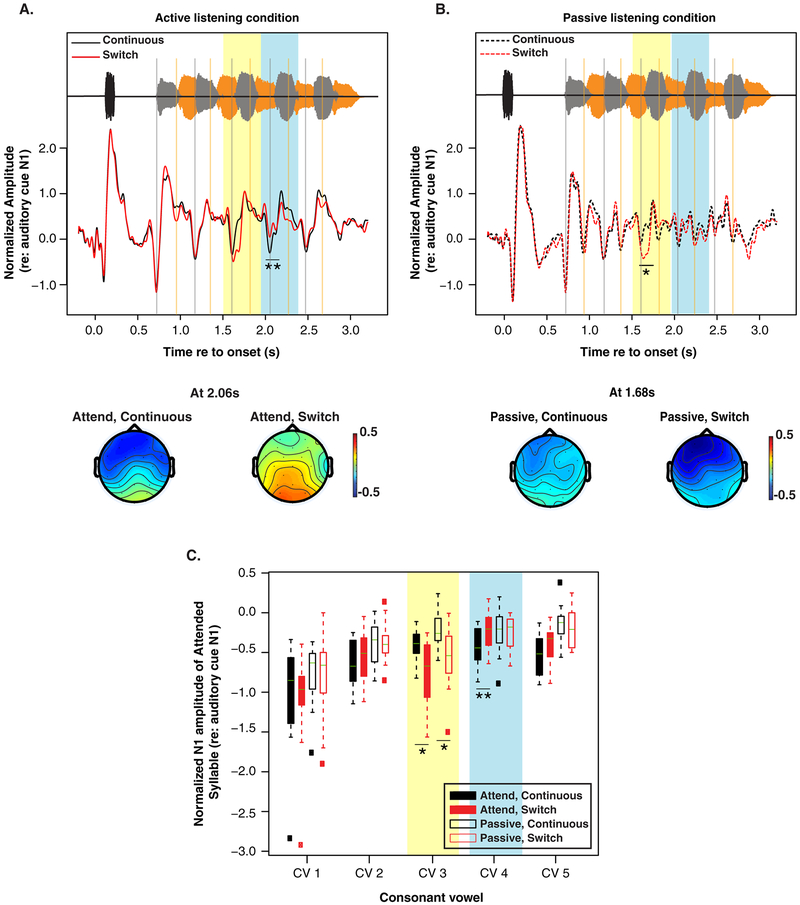
Figure 3:
(A) Grand average epoched EEG response for the active listening continuous (black) and switch (red) trials along with example topographies for each trial type. Vertical grey lines indicate the N1 of CVs in the leading/target stream, while the orange lines indicate the N1s of the CVs in the lagging/distractor stream. The yellow highlighted region indicates the time of the CVs following the switch in talkers, while the light blue highlighted region shows the time of the CVs after the switch. Topographies present the scalp distribution of N1 amplitude for the fourth CV in the leading stream in the to-be-attended continuous, and to-be-attended switch trials. (B) Grand average epoched EEG response for the passive continuous (dashed black) and switch (dashed red) trials. Topographies represent the scalp distribution of N1 amplitude for the third CV in the leading stream in the passive listening continuous and switch trials. (C) Average peak N1 amplitude across subjects for each CV in the target stream for the passive (open box) and active (filled box) conditions. A more negative value on the ordinate indicates a larger N1. Lines in each box plot indicate the median. Highlights correspond to the switch and post-switch CVs, as in panel A and B. *P<0.05, **P<0.01.

