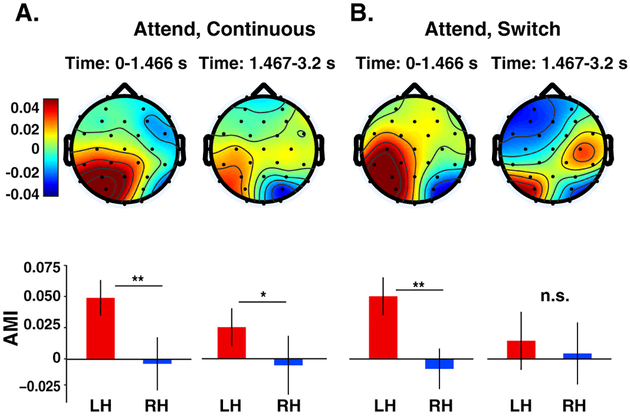
Figure 5:
Topographic maps of the AMIα in two time periods (before and after a potential switch in talker) for continuous (A) and switch (B) trials. Bar graphs show mean across the posterior half of channels (excluding frontal channels) on the left hemisphere (LH) and right hemisphere (RH). Error bars indicate ±1 SEM. AMIα showed a significant hemispheric lateralization (LH>RH) in both conditions before a potential switch. This lateralization remained significant in the second time window in the continuous trials where the talker remained in the same location (A: right panel). In contrast, when the talker switched location in the switch trials, the lateralization pattern was disrupted and was no longer significant. *P<0.05; **P<0.01; n.s., not significant.

