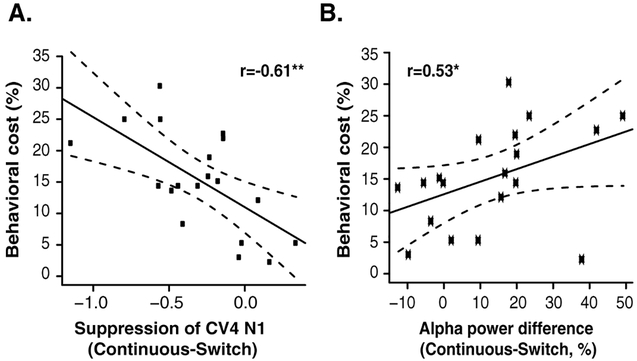
Figure 6:
Relationship between the behavioral cost of talker discontinuity, defined as (% correct in Continuous- % correct in Switch trials), and (A) the difference in the N1 in continuous vs. switch (larger negative values indicate larger suppression of the N1 in the switch trials, corresponding to greater neural disruption of attention) and (B) the decrease in power in the alpha band, both calculated in a time window immediately following the switch in talker. Dashed lines represent 90% confidence intervals. *P<0.05.

