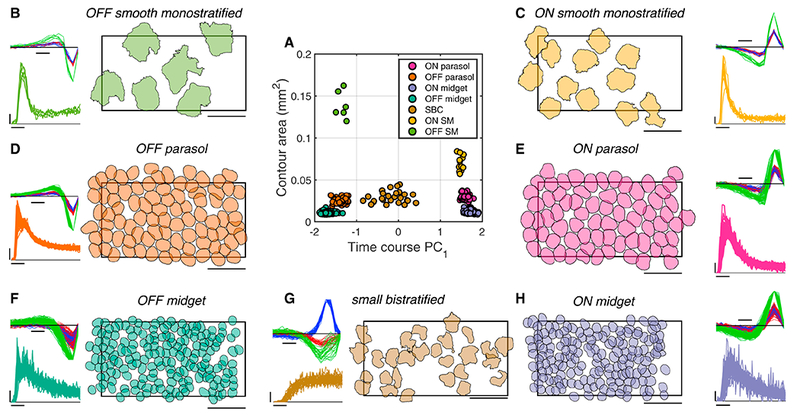
Figure 1: Receptive field properties of simultaneously recorded retinal ganglion cell types.

A: RF contour area and first principal component of time course for each RGC in a single recording form distinct clusters revealing seven distinct cell classes. Temporal equivalent eccentricity: 7 mm (31.4 degrees) (Dacey and Petersen, 1992; Perry and Cowey, 1985).
B: Properties of a single cell class, identified as OFF smooth monostratified (see Fig. 2). Right: contours outline the normalized RF (threshold: 0.18) and are shrunk 30% around their centers for visualization (see Methods). Contours thus should not be interpreted as capturing the RF spatial extent, but as summarizing the relative sizes of RFs of different RGC types. Rectangle indicates the outline of the MEA (1800 μm x 900 μm). Scale bar: 500 μm. Top left: STA time courses for red, green, and blue display phosphors, normalized to the peak for each cell. Scale bar: 50 ms. Bottom left: Autocorrelation function, indicating the probability of a cell spike (scale bar: 0.01) as a function of time (scale bar: 10 ms) relative to the occurrence of the previous spike.
C-H: As in B, for the other cell classes recorded simultaneously.
