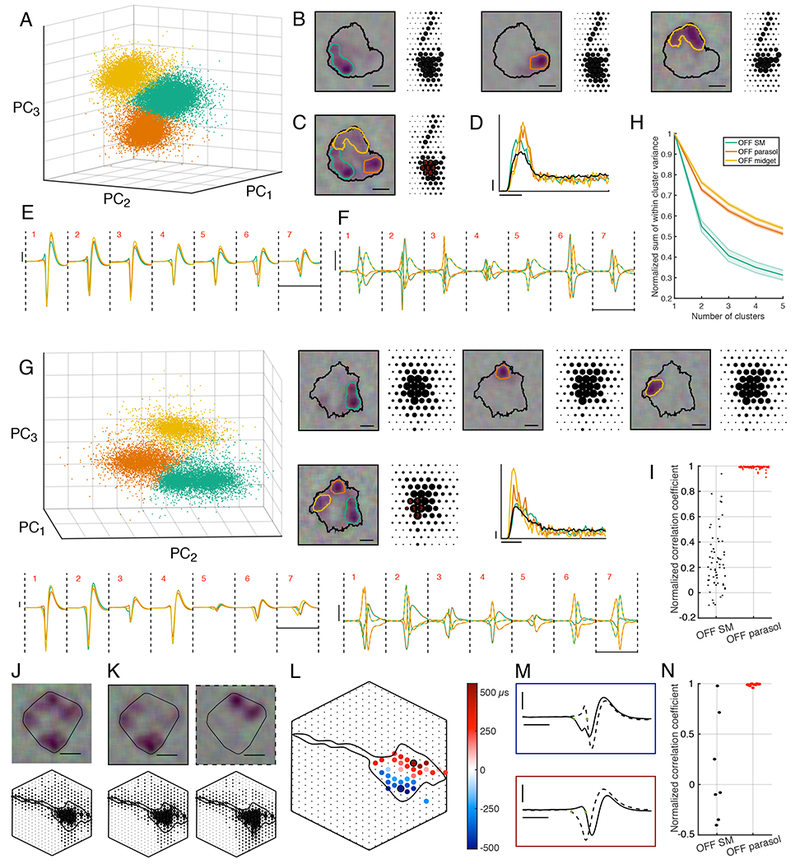
Figure 5: Potential mechanism of receptive field hotspots.

A: First three principal components of the spike signatures from one OFF SM cell. The k-means algorithm identified three clusters, indicated by different colors.
B: RFs and EIs computed from each subcluster of spikes. The black contour was fitted on the full RF (threshold: 0.15), and the colored contours were fitted to subcluster RFs (threshold: 0.3). Scale bar: 200 μm. Electrode spacing: 60 μm.
C: As in B, but with the RF and EI computed from all the SM cell spikes. Red numbers indicate electrodes examined in E, F.
D: Autocorrelation function of the SM cell (black), and of each subcluster (orange, teal, and yellow). Probability of spiking (scale bar: 0.01) is shown as a function of time relative to the previous spike (scale bar: 10 ms).
E: Mean voltage signatures of SM cell spike subclusters, across the seven electrodes used in spike sorting, numbered in red in panel C. Voltage (scale bar: 50 μV) is shown as a function of time (scale bar: 5 ms). Colors correspond to subclusters shown in A.
F: Difference between mean signatures in different sub-clusters from E is shown on an expanded scale. Each line is colored with the two colors representing the subtracted signatures. Scale bars as in E.
G: Same as A-F, for a different OFF SM cell.
H: Sum of within cluster variance divided by total variance in k-means clustering, as a function of the number of clusters (mean ± SEM for 19 SM cells from 11 recordings, 66 parasol cells from 2 recordings, 252 midget cells from 2 recordings).
I: Normalized subcluster EI pairwise correlation coefficients for each cell are shown. Left column: 19 SM cells from 11 recordings. Right column: 34 OFF parasol cells from 2 recordings.
J: The RF and maximum projection of the EI of an OFF SM cell. The convex hull of the contour (threshold: 0.25) is shown. Scale bar: 200 μm. Electrode spacing: 30 μm. Hexagon indicates the outline of the electrode array.
K: The RF and maximum projection of the EI computed from sub-clusters, which together constitute all the spikes from the SM cell indicated in J. Each signature was associated with a different region of the RF, yet the spatial structure of the EI is similar. Scale bar: 200 μm. Electrode spacing: 30 μm.
L: Timing difference between the onset of electrical activity (determined by a threshold) in the two spike subclusters, shown over a collection of electrodes. Red indicates the onset for the second cluster (panel K, dotted border) is earlier than that for the first cluster (K, solid border); blue indicates the reverse. The RFs produced by spikes with different signatures (K) aligns with the locations of earlier onset (see also movie S1).
M: Spike signatures on two electrodes with maximal timing differences (black in L). The blue (red) panel shows the electrical signal originating from the first (second) cluster. Timing differences in L were measured as the difference between the times indicated by the green points. Horizontal scale bar: 1 ms. Vertical scale bar: 50 μV.
N: As in I, for 7 SM cells and 14 parasol cells recorded on an electrode array with 30μm spacing.
