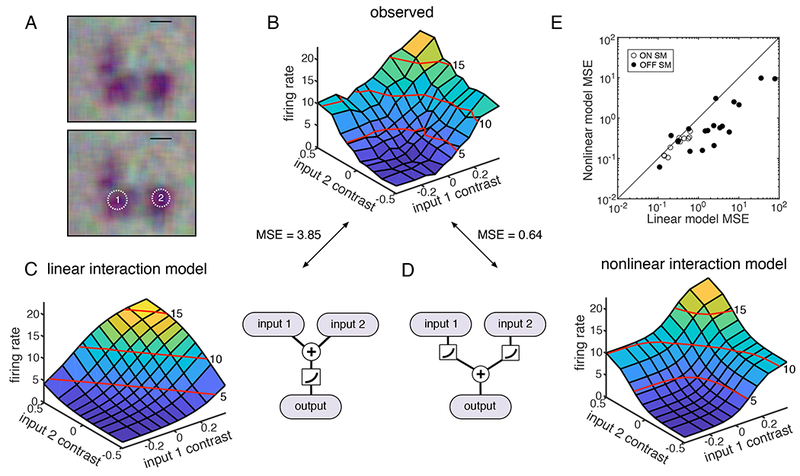
Figure 6: Nonlinearity of hotspots.

A: The RF of an OFF SM cell is shown at top, and again at bottom with two regions targeted for stimulation with equal weight in the RF. Scale bar: 200 μm.
B: Average firing rate of the SM cell as a function of instantaneous contrast on each input region. Red lines indicate contour at 5, 10, and 15 Hz.
C: The predicted firing rate of a linear model is shown as a function of the instantaneous contrast on each input region; schematic shows signals from different input regions summing before rectification.
D: As in C, but for a nonlinear response model, in which signals from different input regions sum after rectification.
E: Mean square error in predicted firing rate from the nonlinear model fits is shown as a function of the error in the linear model fits, for 30 OFF SM cells from 6 recordings.
