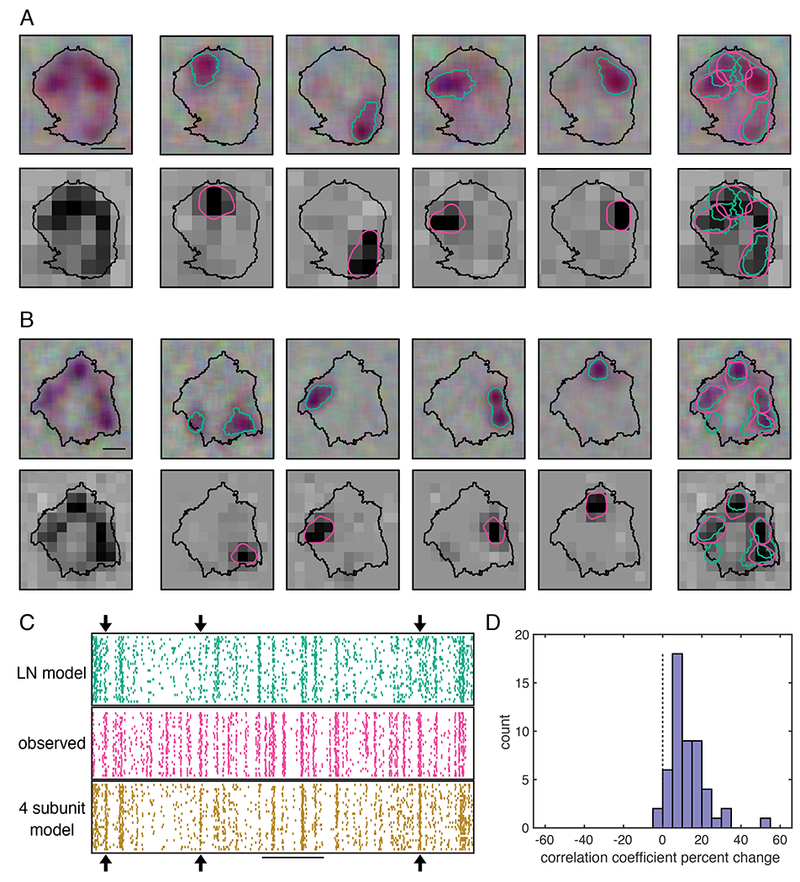
Figure 8: Computational subunits align with regions associated with distinct spike signatures.

A: Left column: The RF of an OFF SM measured with a jittered pixel lattice (top) or fixed lattice (bottom). Contour threshold: 0.15. Scale bar: 200 μm. Top middle four panels: The RFs associated with four spike signature sub-clusters (contour threshold: 0.25), identified as above (Fig. 5). Bottom middle four panels: the four subunit model filters, blurred and shown as contours (threshold: 0.45). Right column: hotspots determined by spike signatures (teal), and model subunits (pink).
B: Same as A, for an OFF SM cell from a different recording.
C: Middle: Raster shows observed OFF SM cell firing over time in response to a white noise stimulus (pixel size: 84.8 x 84.8 μm). Top: LN model prediction of the SM cell response. Bottom: Subunit model prediction. Arrows indicate events captured by the subunit model but not the LN model. Scale bar: 1 s.
D: Histogram of the percent change in the correlation coefficient of the firing rate of the subunit model with the observed firing rate, relative to that of the LN model, for held out validation data (10%). 52 OFF SM cells from 10 recordings.
