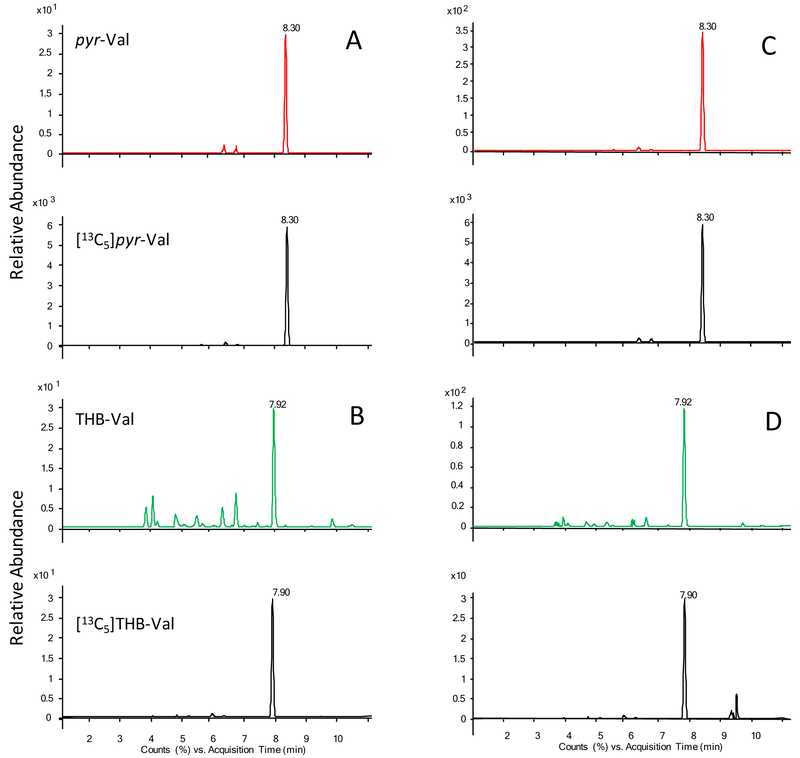
Figure 3:
Representative extracted ion-chromatogram from pyr-Val and THB-val from a patient before (A & B) and after (C & D) treosulfan therapy. Shown are the relative abundance of the ion intensities over time. Note the different scales of the y-axes for sample before and after treosulfan treatment.

