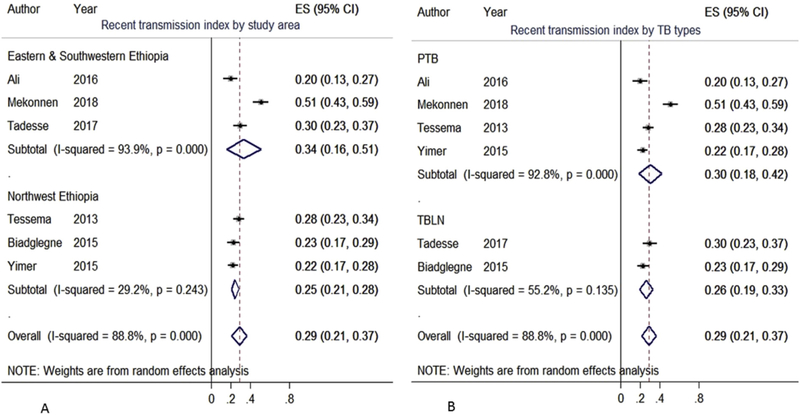
Fig. 5.
Pooled recent transmission index of M. tuberculosis, Ethiopia, 2005–2018.
The box from the forest plot indicated weight of articles from random effect analysis. The crossed line is the 95% CI, the solid vertical line is zero values to x-axis. Random effect RTI meta-analysis showed individual and pooled estimates stratified by area (A) and TB clinical type (B).

