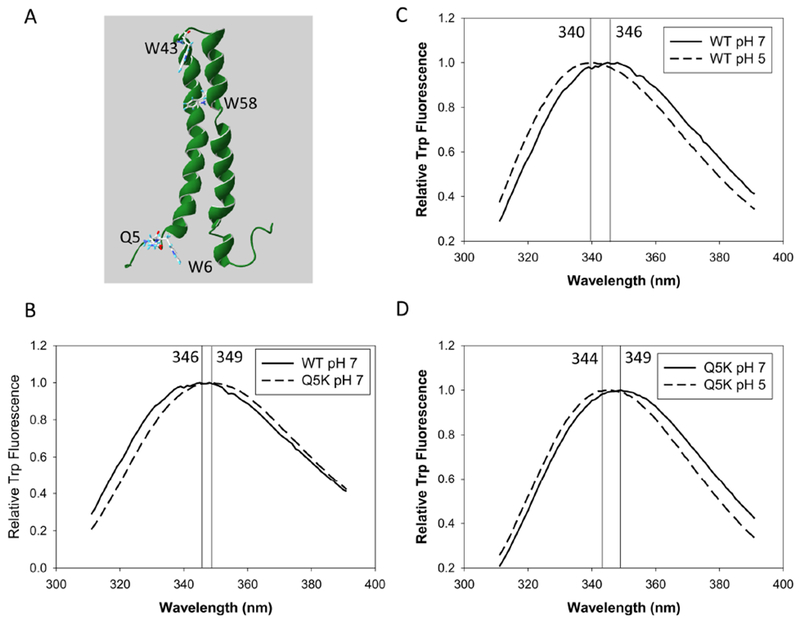
Figure 1. Intrinsic Trp fluorescence of EsxA WT and Q5K in solution.

A. The structure of EsxA is extracted from 1WA8 (PDB) and displayed in Swiss-PDB Viewer. The residues Q5, W6, W43 and W58 are shown. (B-D). 10 μM of EsxA WT and Q5K were incubated either at pH 7 or at pH 5 for 30 min. The samples were excited at 295 nm and the emission spectra of Trp fluorescence of the samples were recorded at 310 – 450 nm. The emission spectra of the proteins were corrected by subtracting the emission spectra of the buffers without proteins. The representative data from at least three independent experiments are shown in the figure. The wavelength at the peak of each spectrum is determined by fitting and smoothing the plots.
