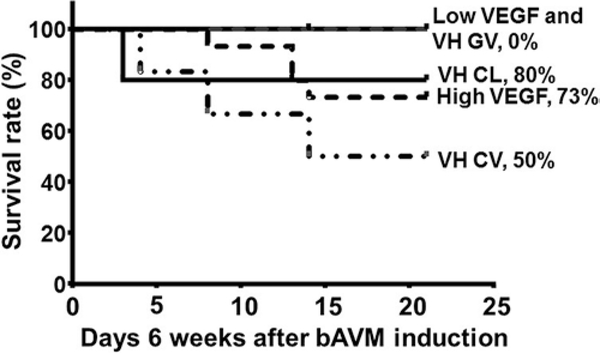
FIG. 5.
Survival curve. The 0 on the x-axis means the first day of week 7 after model induction. Numbers in subgroups were as follows: n = 15 for high-dose VEGF group; n = 11 for low-dose VEGF group; n = 6 for VH CV group; n = 6 for VH GV group; and n = 5 for VH CL group. CL = mice injected with Ad-GFP and AAV-LacZ (WT brain); CV = mice injected with Ad-Cre and low-dose AAV-VEGF (AVM model); GV = mice injected with Ad-GFP and low-dose AAV-VEGF (angiogenesis in WT brain).

