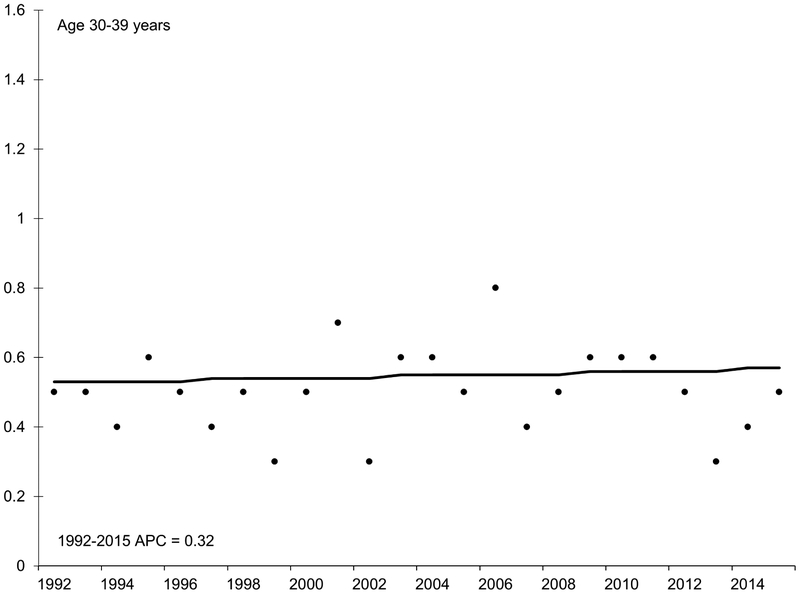
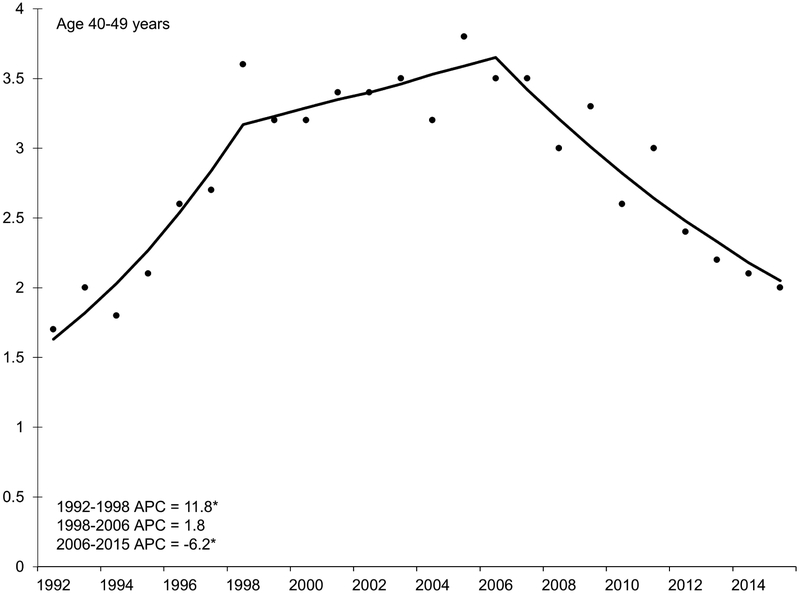
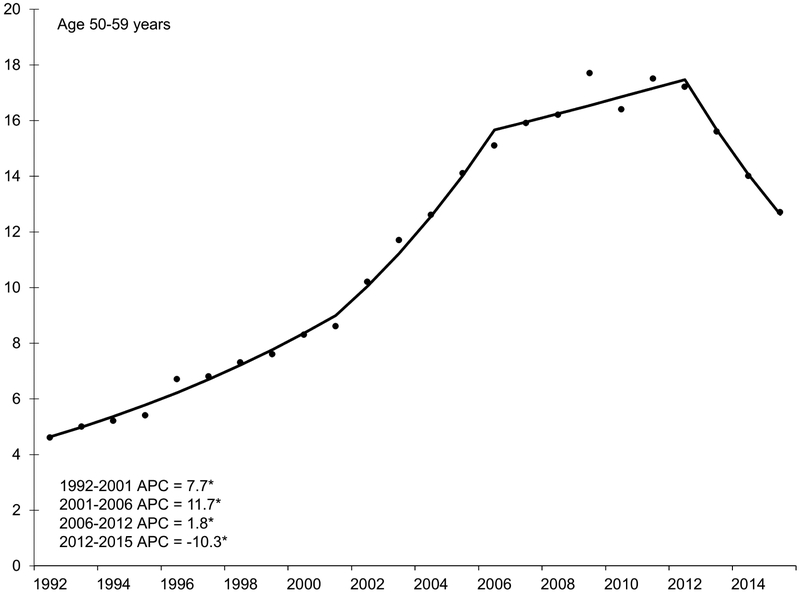
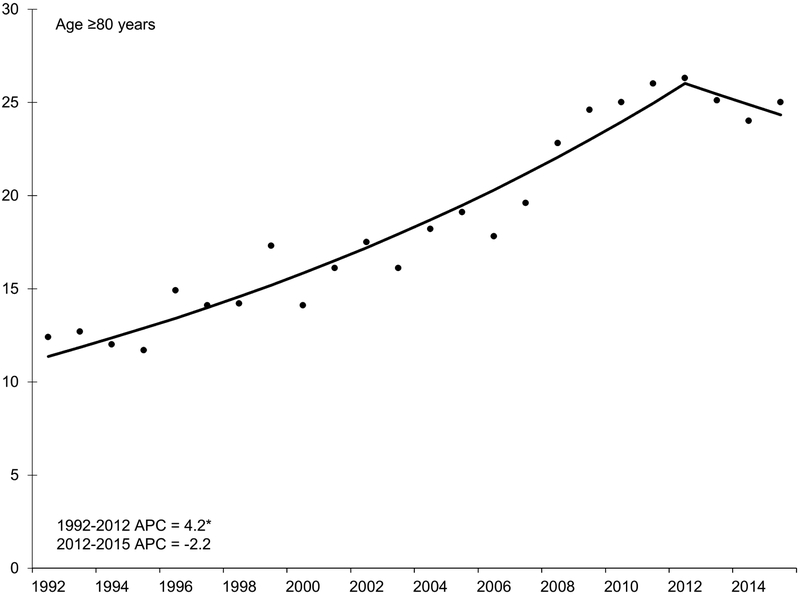
Figure 2.
Annual percent change (APC) in age-specific incidence rates of hepatocellular carcinoma, SEER 13, 1992 – 2015.
NOTE: An asterisk denotes the APC is statistically significantly different from zero (P <0.05) using a two-sided test. APC in 20-29 year age group could not be estimated because the standard error was available and/or number of cases too small. Y-axis scale varies across figures to demonstrate trend.


