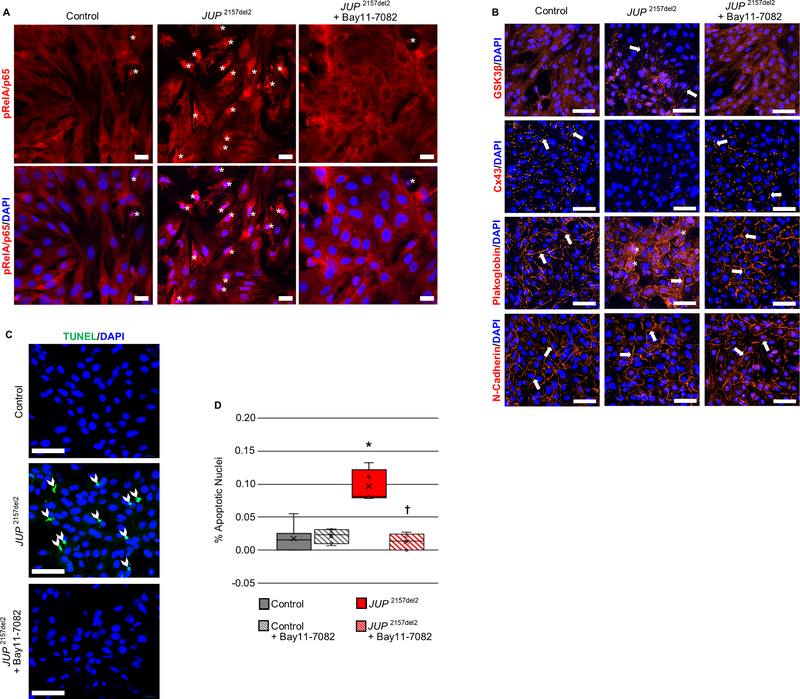
Figure 1. Activation of NFκB and reversal of ACM features by Bay 11–7082 in neonatal rat ventricular myocytes (NRVMs) expressing a deletion mutation in the gene encoding plakoglobin (JUP 2157del2).
A. Representative confocal immunofluorescence images from control (non-transfected) NRVMs and NRVMs expressing JUP 2157del2 in the absence or presence of Bay 11–7082 showing the distribution of phospho-RelA/p65 (pRelA/p65). Nuclear accumulation of immunoreactive signal, indicating activation of NFκB, is readily apparent in cells expressing JUP 2157del2 (asterisks) but is absent in such cells after treatment with Bay 11–7082. Scale bar = 50μm. B. Representative confocal immunofluorescence images from control (non-transfected) NRVMs and NRVMs expressing JUP 2157del2 in the absence or presence of Bay 11–7082. Arrows show localization of immunoreactive signal at the cell surface. The normal distribution of N-cadherin in all cells is shown as a positive control. Untreated JUP 2157del2 cells showed abnormal distribution of plakoglobin, Cx43 and GSK3β. The amount of signal for plakoglobin and Cx43 at cell-cell junctions was greatly reduced in these cells whereas signal for GSK3β, which normally resides in the cytoplasm, was seen at the cell surface. Asterisks identify apparent nuclear localization of plakoglobin in JUP 2157del2 cells. The abnormal distribution of plakoglobin, Cx43 and GSK3β was normalized in JUP 2157del2 cells treated with Bay 11–7082. Scale bar = 50μm. C. TUNEL labeling in control NRVMs and NRVMs expressing JUP 2157del2 in the absence or presence of Bay 11–7082. Representative confocal images show increased TUNEL + nuclei (arrow heads) in cultures of cells expressing JUP 2157del2 and normalization after treatment with Bay 11–7082. Scale bar = 50μm. D. Graph showing the percent (%) apoptotic nuclei in 5 microscopic fields from each condition. * P<0.0001 for JUP2157del2 cells vs. control cells; † P<0.0001 for Bay 11–7082-treated vs. untreated JUP2157del2 cells determined by one-way ANOVA with Tukey’s multiple comparisons test.

