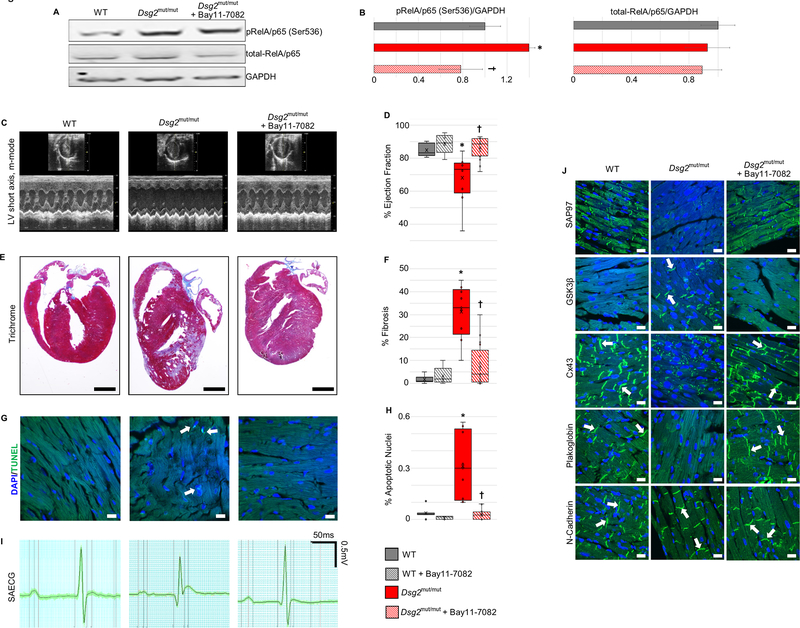
Figure 3. Activation of NFκB and reversal of ACM disease features in Dsg2mut/mut mice in vivo by inhibition of NFκB signaling with Bay 11–7082.
A. Western blots of total RelA/p65 and phospho-RelA/p65 in homogenates of hearts from vehicle-treated wildtype (WT) mice, and vehicle- and Bay 11–7082-treated Dsg2mut/mut mice. B. Group data for total-RelA/p65 and pRelA/p65 (Ser536) protein levels in hearts of vehicle-treated WT mice, and vehicle- and Bay 11–7082-treated Dsg2mut/mut mice. C. Representative short-axis m-mode echocardiograms of vehicle-treated wildtype (WT) mice, Dsg2mut/mut mice and Dsg2mut/mut mice treated with Bay 11–7082. D. Group data for % ejection fraction in vehicle- and Bay 11–7082-treated wildtype (WT) mice, and vehicle- and Bay 11–7082-treated Dsg2mut/mut mice. E. Representative long-axis sections of the hearts stained with Masson trichrome from wildtype (WT) mice, Dsg2mut/mut mice and Dsg2mut/mut mice treated with Bay 11–7082. Scale bar = 1mm. F. Group data for % of left ventricular area occupied by fibrosis in Masson trichrome-stained sections of hearts from vehicle- and Bay 11–7082-treated wildtype (WT) mice, and vehicle- and Bay 11–7082-treated Dsg2mut/mut mice. G. Representative images showing TUNEL labeling in sections of hearts from wildtype (WT) mice, Dsg2mut/mut mice and Dsg2mut/mut mice treated with Bay 11–7082. Arrows show TUNEL+ nuclei. Scale bar = 10μm. H. Group data showing % apoptotic nuclei in TUNEL-labeled sections of hearts from vehicle- and Bay 11–7082-treated wildtype (WT) mice, and vehicle- and Bay 11–7082-treated Dsg2mut/mut mice. I. Representative signal-averaged electrocardiograms (SAECGs) from wildtype (WT) mice, Dsg2mut/mut mice and Dsg2mut/mut mice treated with Bay 11–7082. J. Representative confocal images of immunostained hearts from wildtype (WT) mice, Dsg2mut/mut mice and Dsg2mut/mut mice treated with Bay 11–7082. Arrows show localization of immunoreactive signal at the cell surface. The normal distribution of N-cadherin in all cohorts is shown as a positive control. Untreated Dsg2mut/mut mice showed abnormal distribution of plakoglobin, Cx43, GSK3β and SAP97. The amount of signal for plakoglobin, Cx43 and SAP97 at cell-cell junctions was greatly reduced, whereas signal for GSK3β, which normally resides in the cytoplasm, was seen at the cell surface. These abnormal protein distributions were normalized in Dsg2mut/mut mice treated with Bay 11–7082. Scale bar = 10μm. Quantitative data in panels B, D, F and H are shown as mean ± SEM; n=10 for vehicle-treated WT mice; n=5 for Bay 11–7082-treated WT mice; n=9 for vehicle-treated Dsg2mut/mut mice; and n=17 for Bay 11–7082-treated Dsg2mut/mut mice. * P<0.001 for vehicle-treated Dsg2mut/mut mice vs. vehicle-treated WT mice; † P<0.001 for Bay 11–7082-treated Dsg2mut/mut mice vs. vehicle-treated Dsg2mut/mut mice as determined by one-way ANOVA with Tukey’s multiple comparisons test.

