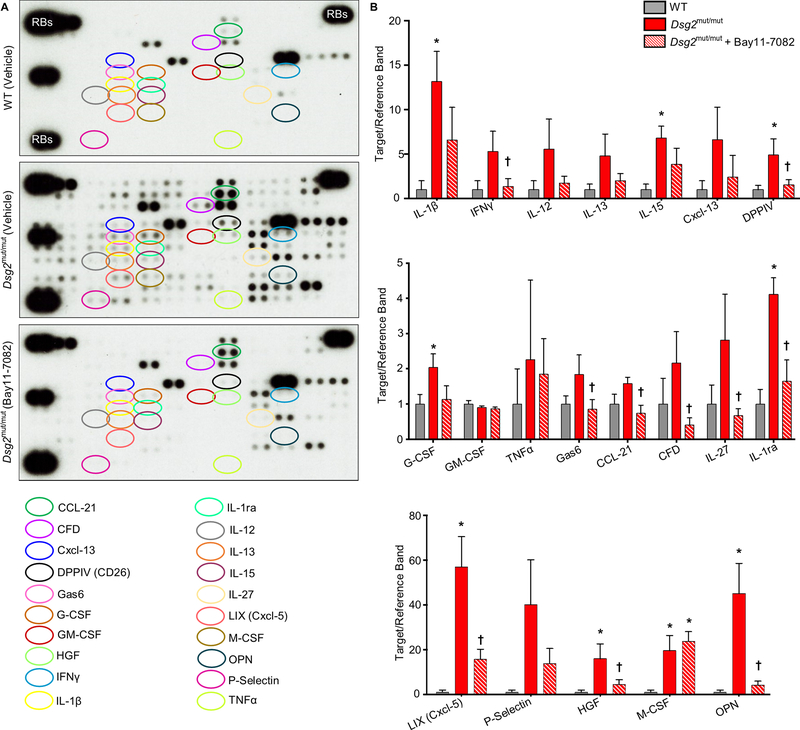
Figure 4. Cytokine expression in the hearts of Dsg2mut/mut mice and its attenuation by Bay 11–7082.
A. Representative cytokine arrays from hearts of vehicle-treated wildtype (WT) mice, Dsg2mut/mut mice and Dsg2mut/mut mice treated with Bay 11–7082. The spots in the upper right and left and lower left corners are reference markers (RBs) to compare overall exposure levels. B. Quantitative data for expression of selected cytokines in hearts of vehicle-treated wildtype (WT) mice, Dsg2mut/mut mice and Dsg2mut/mut mice treated with Bay 11–7082. Data are shown as mean ± SEM; n=5 for each cytokine in vehicle-treated WT and Dsg2mut/mut mice; n=10 for each cytokine in Bay11–7082-treated Dsg2mut/mut mice. * P<0.05 for any cohort vs. vehicle-treated WT mice; † P<0.05 for Bay 11–7082-treated Dsg2mut/mut mice vs. vehicle-treated Dsg2mut/mut mice as determined by one-way ANOVA with Tukey’s multiple comparisons test.

