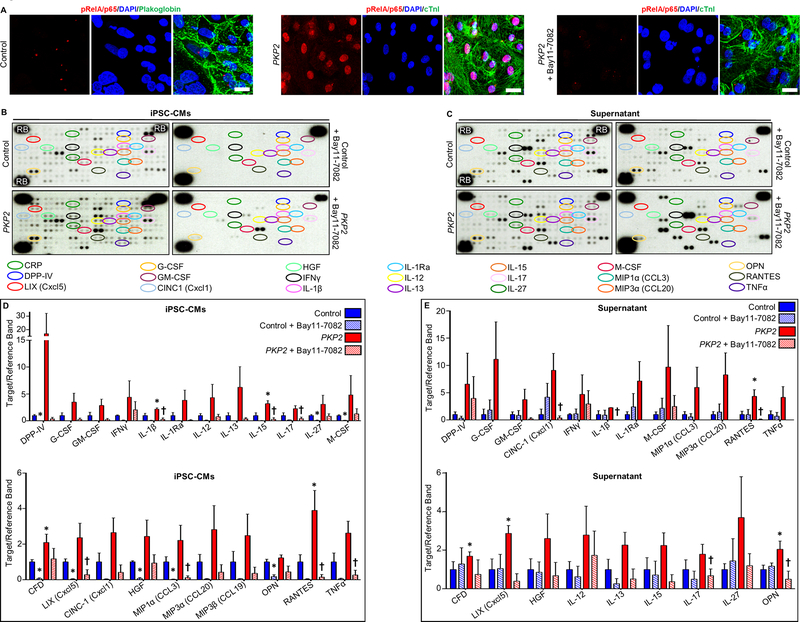
Figure 7. Activation of NFκB and cytokine expression in control and ACM patient derived hiPSC-cardiac myocytes.
A. Representative confocal immunofluorescence images from cultures of cardiac myocytes (CMs) derived from a control hiPSC cell line and a line from an ACM patient with a pathogenic variant in plakophilin-2 (PKP2) grown in the absence or presence of Bay 11–7082. Virtually all PKP2 cells are positive for cardiac troponin-I (cTnI) indicating they are cardiac myocytes. Control hiPSC-CMs showed normal prominent cell surface staining for plakoglobin. Marked nuclear accumulation of immunoreactive signal for phospho-RelA/p65 (pRelA/p65) is seen in PKP2 hiPSC- CMs but not in control cells. Treatment of PKP2 hiPSC-CMs with Bay 11–7082 prevented nuclear accumulation of phospho-RelA/p65 signal. Scale bar = 20μm. B. Representative cytokine arrays prepared from cultures of cardiac myocytes derived from a control hiPSC cell line and a line from a patient with a disease causing variant in plakophillin-2 (PKP2). Arrays are shown for cells grown in the absence (untreated) or presence of Bay 11–7082. The spots in the upper right and left and lower left corners are reference markers (RBs) to compare overall exposure levels. C. Quantitative data (mean ± SEM; n=3 for each cohort and condition) for expression of selected cytokines in control and PKP2 cells with or without Bay 11–7082. * P<0.05 for any cohort vs. control cardiac myocytes; † P<0.05 for Bay 11–7082-treated PKP2 cardiac myocytes vs. untreated PKP2 cardiac myocytes. D. Representative cytokine arrays prepared from culture media (supernatant) from cardiac myocytes derived from a control hiPSC cell line and a line from a patient with a disease causing variant in PKP2. Arrays are shown for media isolated from cells grown in the absence or presence of Bay 11–7082. The spots in the upper right and left and lower left corners are reference markers (RBs) to compare overall exposure levels. E. Quantitative data (mean ± SEM; n=3 for each cohort andcondition) for expression of selected cytokines in media from control and PKP2 cells with or without Bay 11–7082. * P<0.05 for any cohort vs. control cardiac myocytes; † P<0.05 for Bay 11–7082 treated PKP2 cardiac myocytes vs. untreated PKP2 cardiac myocytes. Statistical analyses in panels C and E were performed using one-way ANOVA with Tukey’s multiple comparisons test.

