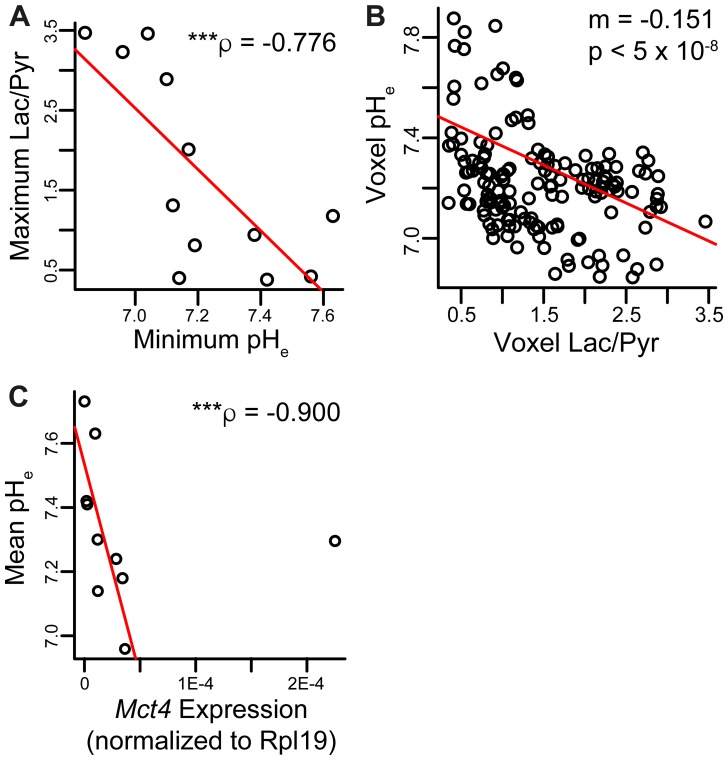
Figure 6. Correlations between metabolic parameters and pHe.
(A) Spearman non-parametric regression between maximum Lac/Pyr and minimum pHe in each ROI showed a strong negative correlation (n = 12 lesions). (B) The measured Lac/Pyr ratio and pHe in each imaging voxel across all mice were negatively correlated. The pH decreased by about 0.15 unit per unit increase in Lac/Pyr ratio (n = 153 voxels). (C) Spearman non-parametric regression between mean pH and Mct4 gene expression was strongly negative and statistically significant (n = 10 lesions). Two of the twelve lesions imaged had Mct4 gene expression levels below the threshold of quantification; these lesions had average pHe values of 7.30 and 7.56. ρ and p-value in plot exclude the outlier; the correlation was still significant with outlier included (p = 0.00824). *** p < 0.005.

