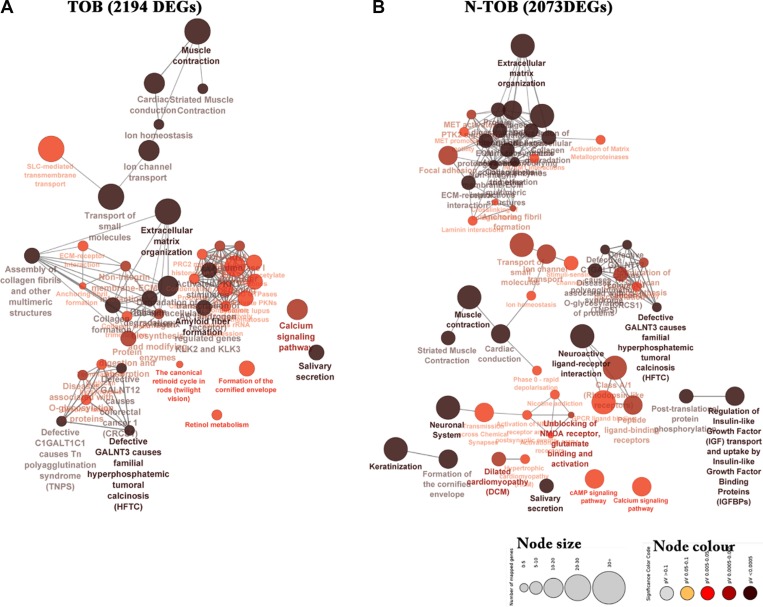
Figure 5. Network representing enriched pathways integrated KEGG and Reactome pathways of both TOB and N-TOB tumors.
Highest significance of enriched pathway was obtained using advanced statistical settings such as Hyper-geometric (right-handed) enrichment distribution tests, p-value < 0.05, and Bonferroni adjustment. The size and colour represents number of DEGs involved and enrichment significance respectively- deeper the colour, the higher the enrichment significance.

