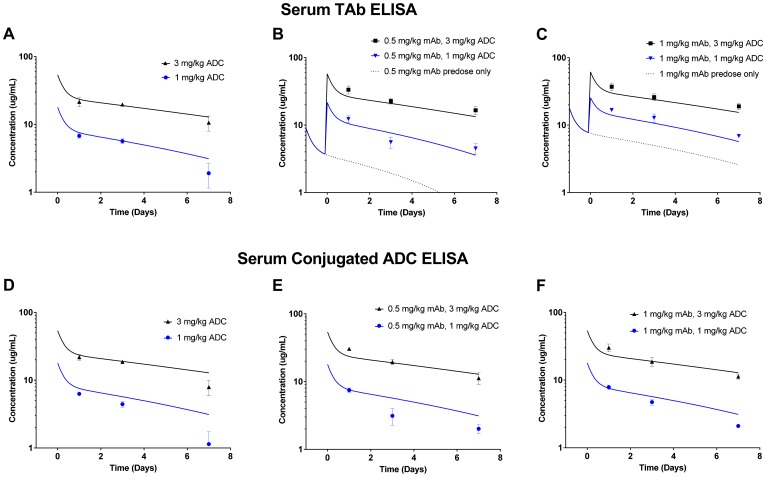
Figure 7. Serum exposure data from mice in the in vivo LuCaP96.1 tumor growth inhibition with anti-TENB2 ADC.
Overall, observed data points agree well with model simulated PK curves. Serum total antibody ELISA (detecting both mAb and ADC) data for mAb/ADC at predose levels of 0, 0.5 and 1 mg/kg are shown in (A), (B), and (C), respectively. Serum conjugated ADC ELISA (detecting only ADC) data for ADC at mAb predose levels of 0, 0.5, and 1 mg/kg are shown in (D), (E), and (F), respectively. Note that, in (B) and (C), simulated PK curves take into account the contribution of total antibody from both mAb predose and ADC.

