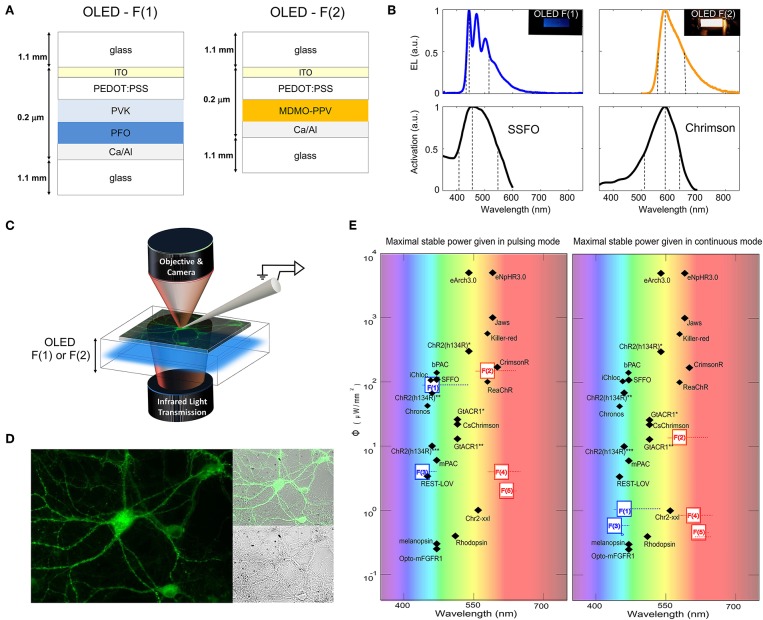
Figure 1.
Blue and orange OLEDs based on PFO and SO-PPV use for photo-activation of SSFO and ChrimsonR, respectively. Device architectures (A) and emission spectra (B) for blue PFO and orange SO-PPV OLEDs. Due to the use of a thin (<100 nm) Al-capping layer, both sets of devices were translucent in the near infrared range, allowing simultaneous photo-stimulation and patch-clamp recordings guided by infrared transmission and epifluorescence. (C) Due to the use of a thin (<100 nm) Al-capping layer, both sets of devices were translucent in the near infrared range, allowing simultaneous photo-stimulation and patch-clamp recordings guided by infrared transmission and epifluorescence. (D) Fluorescence images of neurons expressing eGFP and located at the surface of the blue PFO OLED, alongside the near infrared transmission image. (E) Maximal optical output of solution-processed blue and red-shifted OLEDs with respect to the activation requirements of a toolbox of optogenetic probes. Fluorescent OLEDs are represented with their active layer number F(x) and following Glass/ITO/Pedot:Pss/F(x)/Ca/Al structure with PFO and PVK for F(1) devices; Super Orange (SO-PPV) for F(2) devices; PFO for F(3); MEH-PPV for F(4); CN-PPV for F(5). References for OPSIN tools are: ChR2-XXL (Dawydow et al., 2014); Rhodopsin (Cehajic-Kapetanovic et al., 2015); Jaws (Chuong et al., 2014); ChR2(H134R) (Yu et al., 2015); Killer Red (Williams et al., 2013); GtACR1*, GtACR1** (Govorunova et al., 2015); CsChrimson (Mohammad et al., 2017); Melanopsin (Beiert et al., 2014); bPAC (Stierl et al., 2011); REST-LOV (Paonessa et al., 2016); ChR2(H134R)* (Reinbothe et al., 2014); C1V1(E162T) (Packer et al., 2012); mPAC (Raffelberg et al., 2013); Opto-mFGFR1 (Grusch et al., 2014); ChR2(H134R)** (Maimon et al., 2017); ReaChR1 (Kaufmann et al., 2017); eNpHR3.0, eArch3.0 (Mattis et al., 2011); Chronos (Klapoetke et al., 2014); iChloC (Wietek et al., 2015).

