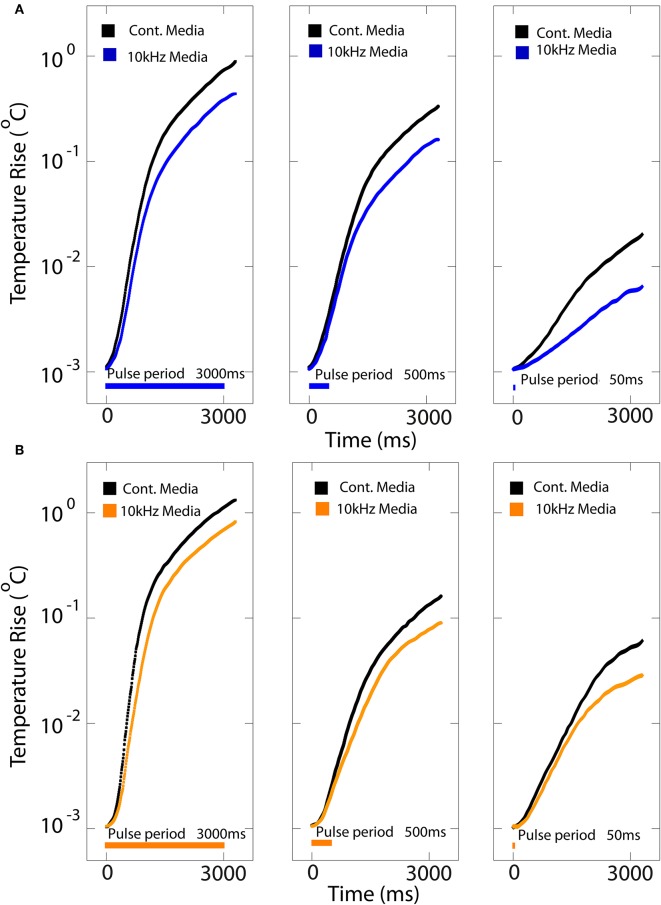
Figure 3.
Heating profile of blue and orange OLEDs. The steady-state temperature rise at the surface of a coverslip positioned onto the blue (A) and orange (B) OLEDs immersed in cell-culture medium vs. time for either DC (cont.; black traces) and 10 kHz square-wave (colored traces) stimulation at 30 V optical power corresponding to for blue and for orange OLEDs for pulse durations of 50, 500, and 3,000 ms.

