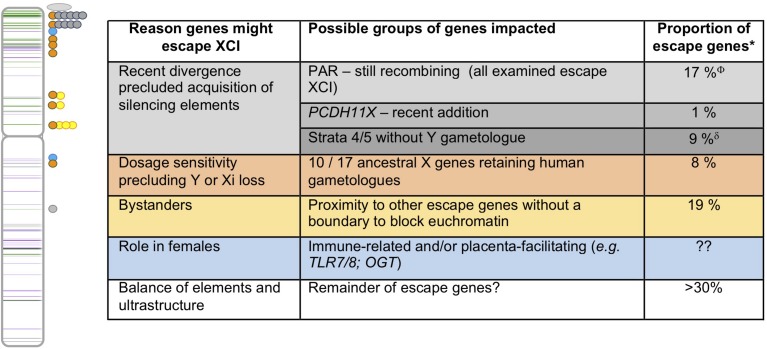
FIGURE 2.
Human escape genes and possible underlying evolutionary reasons for their ongoing expression from the Xi. On the left is an ideogram of the X chromosome showing the genes that escape XCI (green) or variably escape XCI (purple) with lines appearing darker when multiple genes are nearby (data from Balaton et al., 2015). Circles to the right of the chromosome reflect locations of escape genes with features highlighted in the table to the right. The color of the dots matches the table, with PAR1 genes shown as an oval, given their abundance. ∗As tabulated in Balaton et al. (2015); ΦIncludes three ancestral X genes; δIncludes four ancestral X genes.

