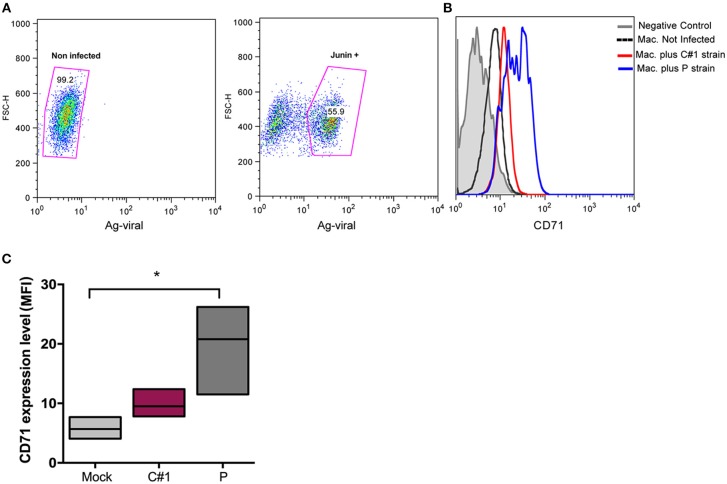
Figure 2.
JUNV enhances CD71 expression in human macrophages with P showing the highest values. HMDM cells were infected at a multiplicity of infection (MOI = 1) with C#1 or P strains of JUNV. After 3 dpi, cells were double stained with anti-JUNV and anti-CD71 and analyzed by flow cytometry. (A) Representative dot-plots showing positive signal for viral antigen in macrophages. (B) Representative histogram showing CD71 expression after gating in positive cells for JUNV antigen and negative controls. (C) Expression level of CD71 analyzed as mean fluorescent intensity (MFI) in graph. Non-parametric One-way ANOVA followed by Dunn's multiple comparison test was used to detect significant differences between groups; *P < 0.05. The results are graphed as the median (min-max, horizontal line indicates the median) of at least four independent donors in each assay.

