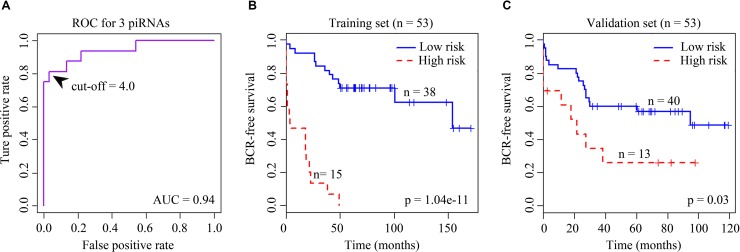
Figure 1.
(A) Receiver operating characteristic (ROC) curve for the signature of four BCR-associated piRNAs. The ROC curve was generated for BCR predictions with an area under the curve of 0.94. Optimal cutoff value was 4.0. (B) Kaplan–Meier survival curves for 53 cases in the training set analyzed by a three-piRNA signature. (C) Kaplan–Meier survival curves for 53 cases in the validation set analyzed by a three-piRNA signature.

