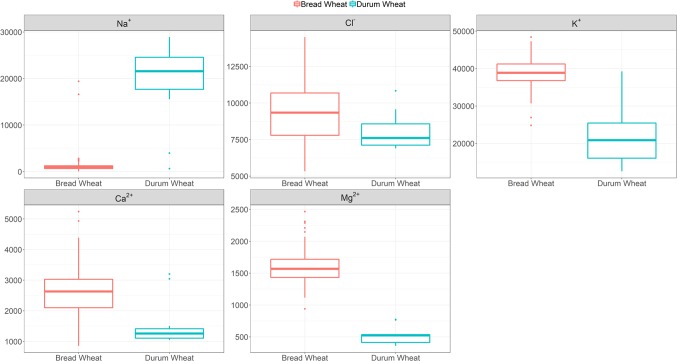
Figure 1.
Boxplots of leaf Na+ (back-transformed), Cl-, K+, Ca2+ and Mg2+ concentrations (mg kg-1 DW) at heading in 100 bread wheat entries, 12 durum wheat entries and a barley cultivar grown under sodicity (8 g kg-1 Na+-humate) in Experiment 1 (n = 4). See Table S3 for individual responses. The box represents the middle 50% of the distribution (the median is drawn as the solid line within the box) with whiskers extending to the lowest/highest value within 1.5* IQR (Inter-Quartile Range). Values outside this range are plotted separately.

