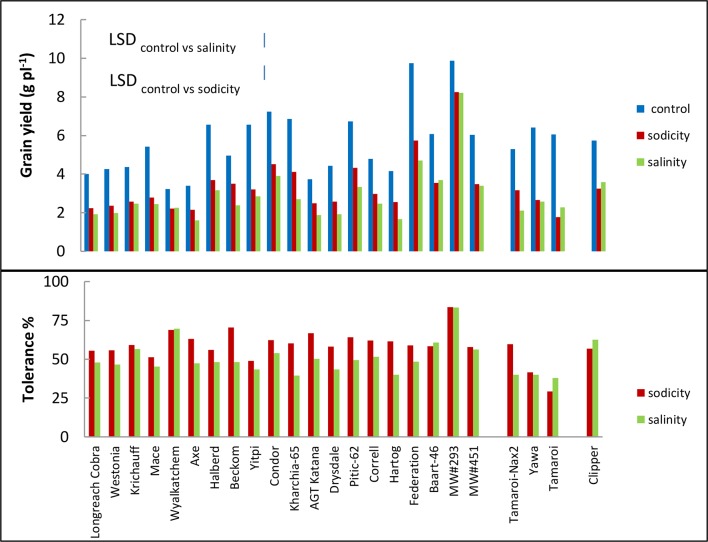
Figure 5.
Best linear unbiased estimates for grain yield, and tolerance (grain yield under sodicity or salinity as a percentage of grain yield under control) of 20 bread wheat entries (Triticum aestivum L.), three durum wheat entries (Triticum turgidum subsp durum cv. Tamaroi, Tamaroi-Nax2 and Yawa) and one barley (Hordeum vulgare L. cv. Clipper) in Experiment 3 (n = 4). The vertical bars indicate Least Significant Difference test value at P = 0.05 for variety x treatment interaction. Entries are ordered in ascending order of leaf Na+ concentration.

