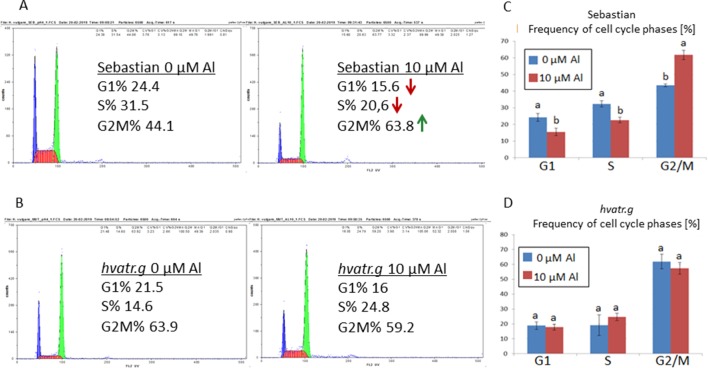
Figure 5.
Flow cytometric analysis of the cell cycle profiles in root meristematic cells of ‘Sebastian’ and the hvatr.g mutant. (A) Examples of representative histograms for ‘Sebastian’ grown in control conditions and treated with 10 μM Al. (B) Examples of representative histograms for the hvatr.g mutant grown in control conditions and treated with 10 μM Al. (C) Frequencies of cell cycle phases in the root meristems of ‘Sebastian’ untreated and treated with 10 μM Al. (D) Frequencies of cell cycle phases in the root meristems of the hvatr.g mutant untreated and treated with 10 μM Al. Statistical analyses were performed using ANOVA (P < 0.05) followed by Tukey’s honestly significant difference test (Tukey HSD test, P < 0.05) in order to assess the differences between treated and untreated samples. Statistically significant differences are indicated by different letters.

