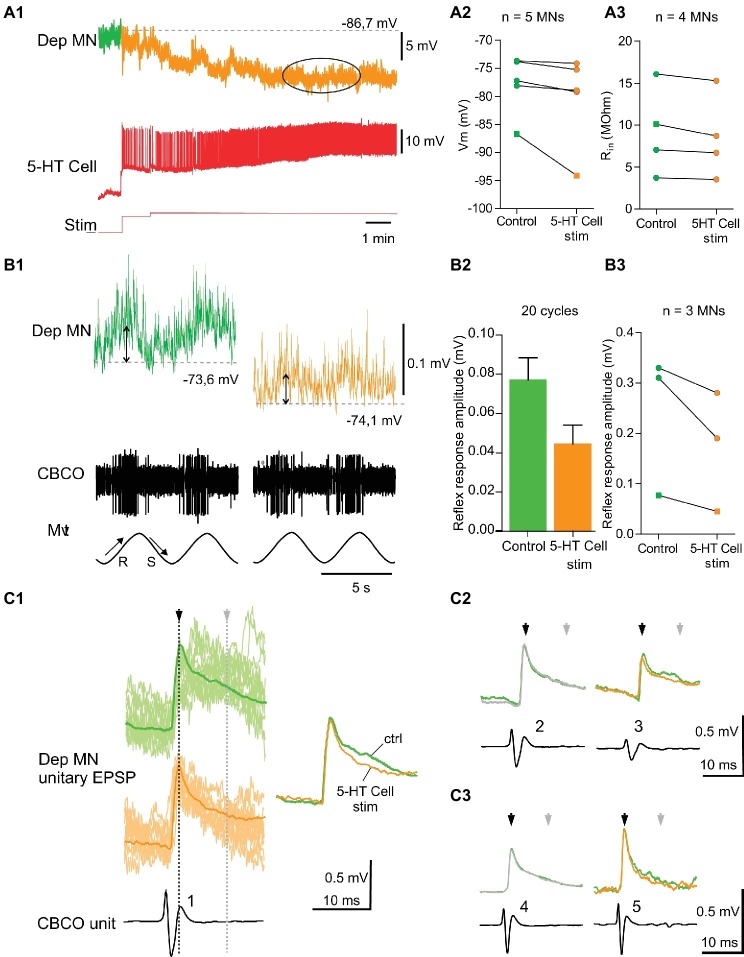
Figure 5.
Inhibitory effects induced by 5-HT cell activation on Dep MNs. (A1) hyperpolarizing response of an intracellularly recorded Dep MN to the ipsilateral A1 5-HT cell intracellular stimulation. (A2) Inhibitory effect of 5-HT cell activation on 5 Dep MNs. Square symbol represents trace used in A1. (A3) Decrease of input resistant (Rin) from four MNs when 5-HT cell are stimulated. Membrane potential of these MNs decreases also. Square symbol represents trace used in A1. (B1) Decrease of the amplitude of the sensory-motor response of an intracellularly recorded Dep MN during 5-HT cell activation (same dispositions as in Figure 4). (B2) In this experiment, reflex response amplitude decreases from 0.077 ± 0.011 mV (averaged from 20 cycles) to 0.045 ± 0.009 mV (averaged from 20 cycles). (B3) Decrease of sensory-motor response recorded from three MNs, after the 5-HT cell stimulation. Square symbol represents trace used in A1. (C1) Examples of change of unitary EPSPs’ shape induced in Dep MN that showed a hyperpolarizing response to 5-HT cell activation. In control condition and after 5-HT cell stimulation, superimposed raw data (light traces) and corresponding average EPSP traces (dark traces) are presented. (C2,C3) Mean EPSP amplitudes measured at peak (black arrows) and 15 ms after peak in the late part of the decay phase (gray arrows). C2 and C3 represent two different experiments.

