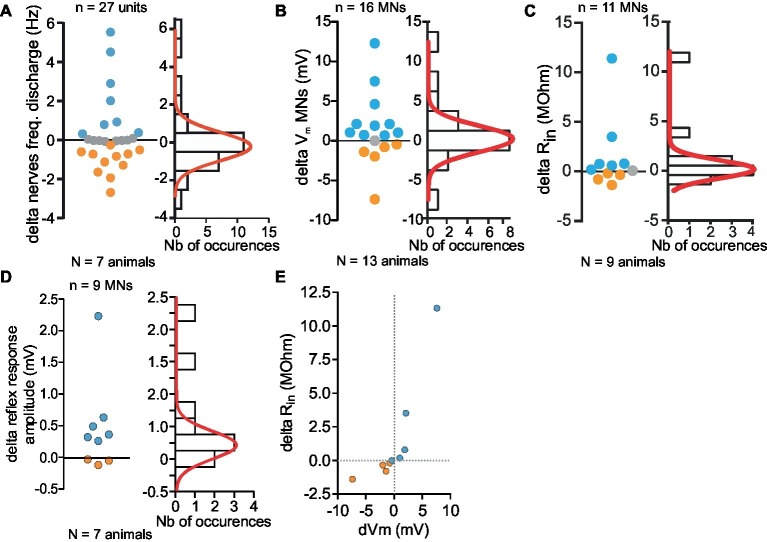
Figure 7.
Monotonal distribution of effects of 5-HT cell activity on Depressor MNs. (A–D) Variety of responses magnitude (firing frequency, A; Vm, B; Rin, C; reflex response, D) measured in in vitro preparations (left panel). Distribution of all changes and their distribution histogram fitted with a Gaussian curve (right panel). (E) Correlation between the changes of input resistance (Rin) and membrane potential changes of eight MNs. Orange and blue dots represent respectively inhibitory and excitatory effects induced by stimulation of 5-HT cell. All depolarizing changes of Dep MNs were associated with an increase of Rin. Hyperpolarizing changes were associated with a Rin decrease.

