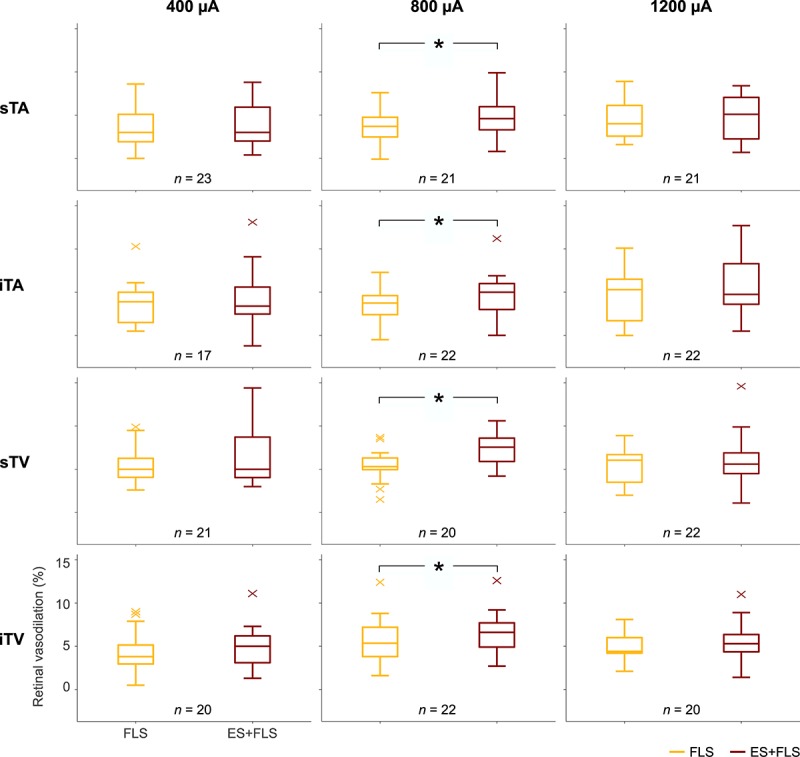
FIGURE 5.

Box-and-whisker plots of retinal vasodilation after provocation with flicker light stimulation (FLS) and electrical and flicker light stimulation (ES+FLS). The left column shows the values of the 400 μA group for the investigated vessel segments (from top to bottom): superior temporal artery (sTA); inferior temporal artery (iTA); superior temporal vein (sTV); inferior temporal vein (iTV). Correspondingly, the middle column shows the diagrams of the 800 μA group and the right column the diagrams of the 1200 μA group. Statistically significant differences are indicated with ∗ (paired t-test, p < 0.05).
