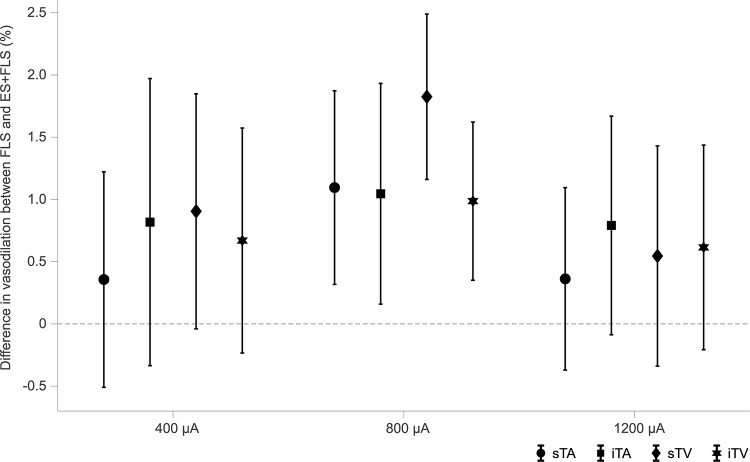
FIGURE 6.
Confidence intervals (confidence level 95%) of the differences between stimulus conditions flicker light stimulation (FLS) and electrical and flicker light stimulation (ES+FLS) for each group and each vessel segment [superior temporal artery (sTA); inferior temporal artery (iTA); superior temporal vein (sTV); inferior temporal vein (iTV)]. Confidence levels that do not include the zero value indicate significant differences.

