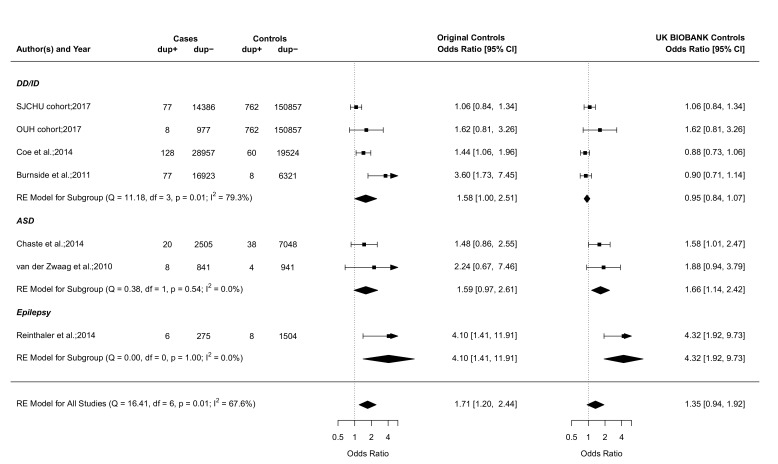
Figure 2.
The 15q11.2 duplication case–control studies of neurodevelopmental disorders. Forest plot showing the results of seven studies18 20 21 30 31 including the SJCHU and OUH cohorts examining the association between the 15q11.2 duplication and the OR of a neurodevelopmental disorder in cases versus controls. Of note, the year reported for the SJCHU and OUH cohorts refers to the year the data were extracted and analysed. Published studies are detailed in the online supplementary table S2. Data in the individual studies are reported with corresponding 95% CI based on a RE model. The test for heterogeneity (Q=16.41, df=6, p=0.01, I2=67.6%) for OR (left side) using the original control population suggests important heterogeneity among the studies. Publication bias was assessed in a funnel plot (online supplementary figure S3) and the Egger’s test was used to test for funnel plot asymmetry (z=3.3826, p=0.0007). This result suggests asymmetry in the funnel plot, and the presence of publication bias. ASD, autism spectrum disorders; dup+, cases or controls with the duplication; dup−, cases or controls without the duplication; DD/ID, developmental delay/intellectual disability; df, number of studies; OUH, Odense University Hospital; Q, X2 test of heterogeneity; RE, random effect; SJCHU, Saint-Justine University Hospital. See figure 1 legend for more details.

