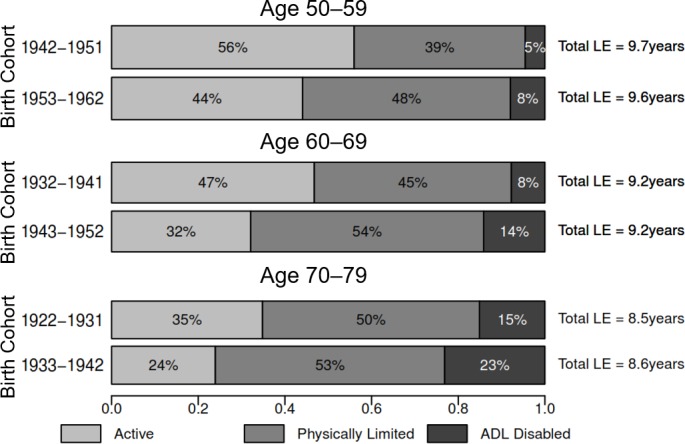
Figure 3.

Proportion of remaining LE in active, limited and ADL-disabled life, ages 50–59, 60–69 and 70–79, women. The height and area of each bar are proportional to the overall LE in ages 50–59, 60–69 and 70–79, and the differently shaded areas represent the distribution of the LE across disability-free, physically limited and ADL-disabled life. The bars do not necessarily reflect the ordering of these life-years by disability states, as individuals in our analysis can recover and relapse between disability states, so not all years of disability are spent at the end of life. ADL, activities of daily living; LE, life expectancy.
